Quick Fact: Preparing for Mainland Power Outages
As OPALCO noted in our 2021 Decarbonization Quick Fact:
- Carbon emissions have jumped over 30% during the last 100 years.
- As many as 1 million species are now at risk of extinction.
- To slow the climate emergency, Washington plans to cut greenhouse gas emissions (GHGs) by 50% by 2030 and net-zero by 2050.
- Washington’s 2021 Energy Plan projected load would nearly double by 2050.
Now, in 2024, we note progress has been slow as stakeholders grapple with the details, and the full massive scale of Washington’s objectives is sinking in.
- NW hydropower is at capacity.
- Coal plants are being rapidly decommissioned. This is good for reducing GHG emissions but also reduces the electricity supply.
- Demand is quickly exceeding supply, especially during extreme heat and cold weather events (which are accelerating with climate disruption).
- Mainland power outages are increasingly likely as demand outruns supply.
There is a massive growing need for renewable energy
New renewable energy generation is needed fast. The state and NW region are working to develop new wind and solar projects and increase imported energy from our neighbors, but:
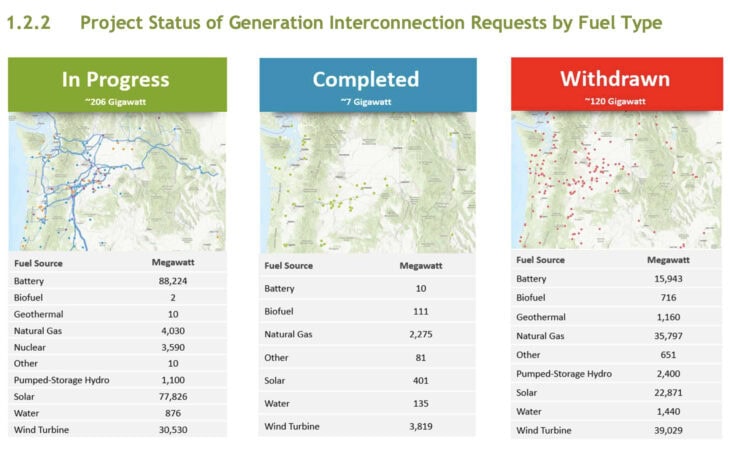
- The Bonneville Power Administration (BPA) has approximately 208 gigawatts (GW) of resources in its transmission connection queue. However, only a fraction of these queued projects are built and operational. As of now, only 20 GW of generation capacity is actually connected and capable of producing power. The majority of the projects in the queue are in various stages of development, facing regulatory, financial, or construction hurdles before they can be realized and contribute to the grid.
- Northwest wind, solar, and transmission projects potentially require over 1,000,000 acres of land. Permitting, regulatory restrictions, and public opposition have led to over 70% of these sorts of projects being canceled nationally.
- This is consistent nationally: Only 10 percent of the low-emissions power capacity needed by 2050 to meet global climate commitments is currently deployed. Navigating the remaining 90 percent requires confronting the reality that the energy transition is, at its core, a physical transformation on a colossal scale.
Recent Northwest studies show the need for new renewable energy is massive
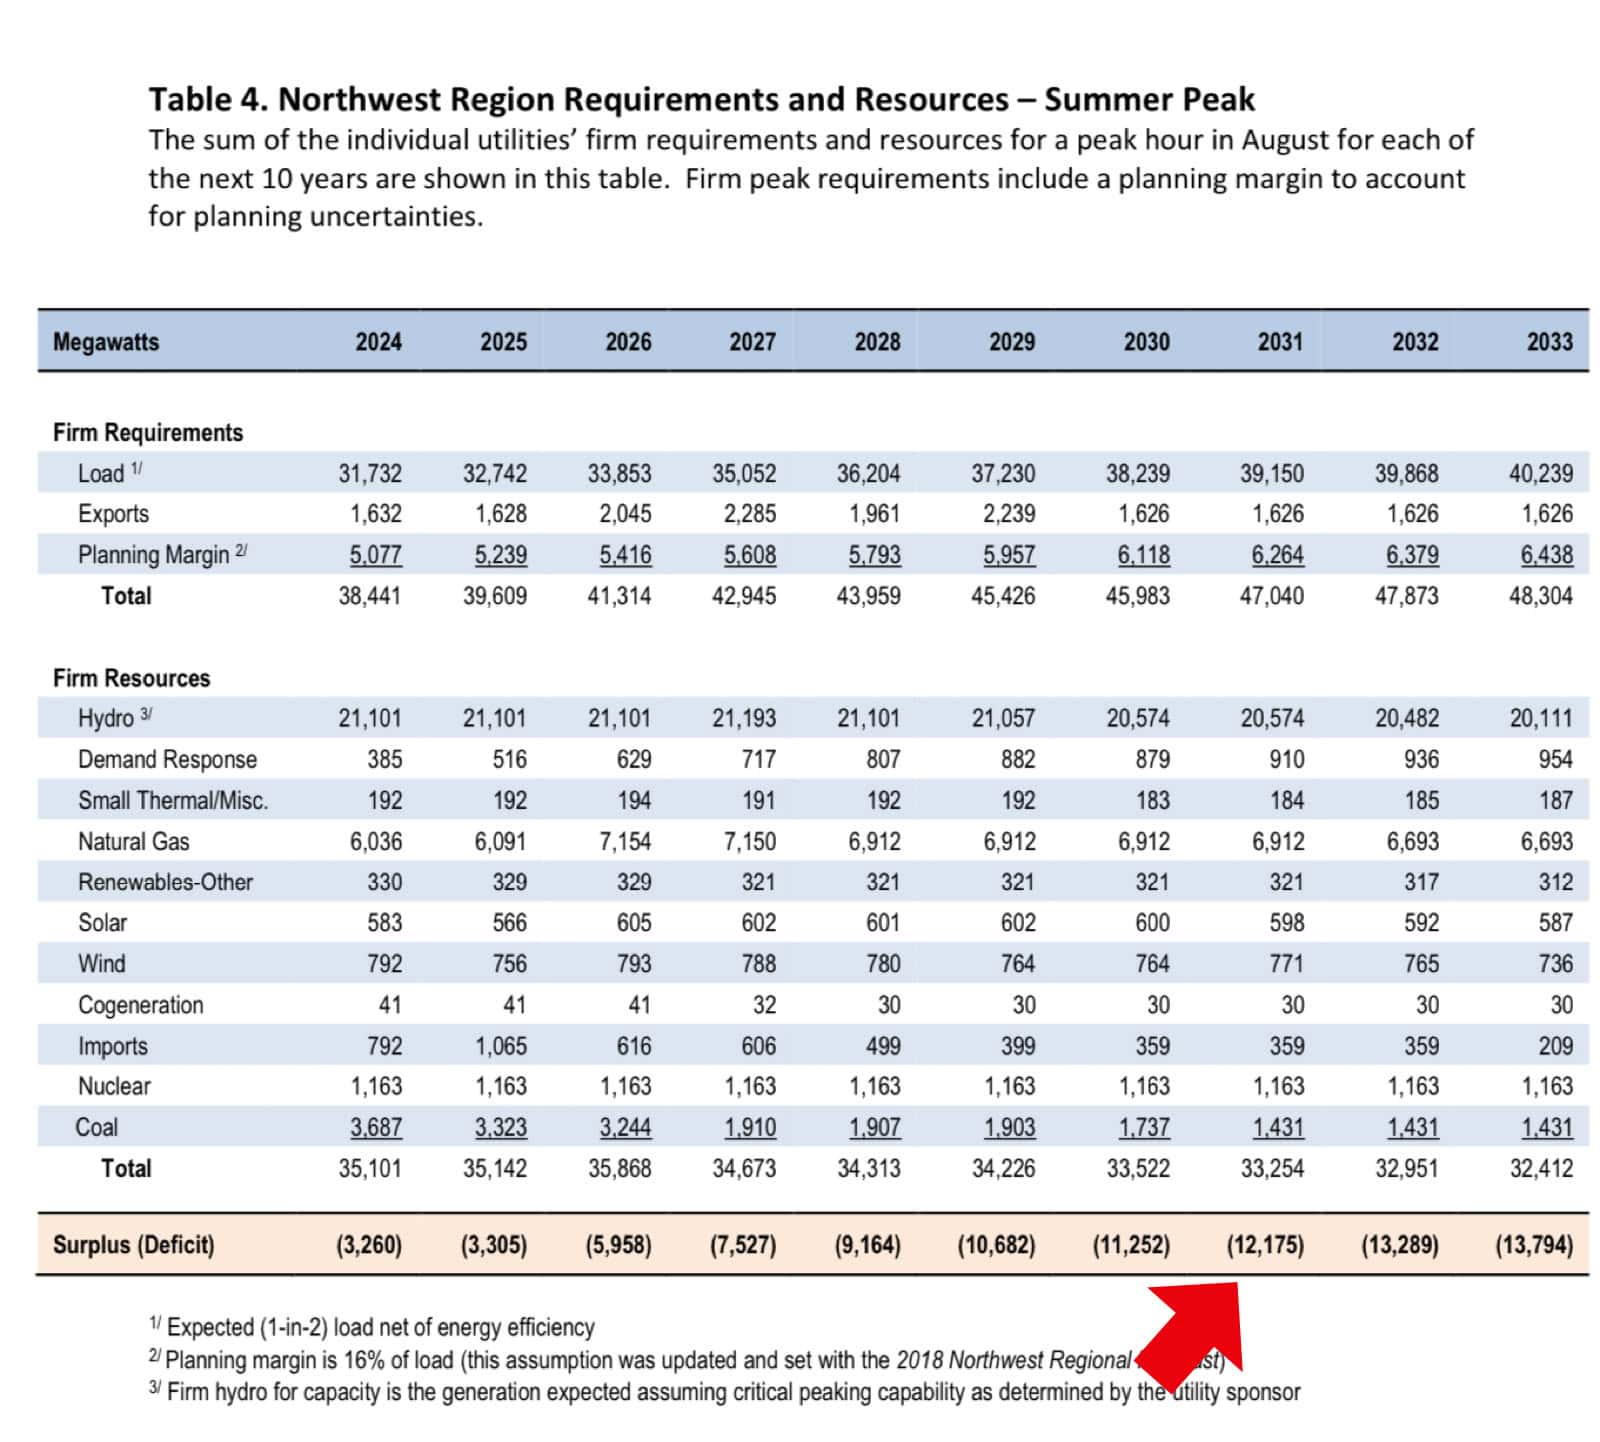
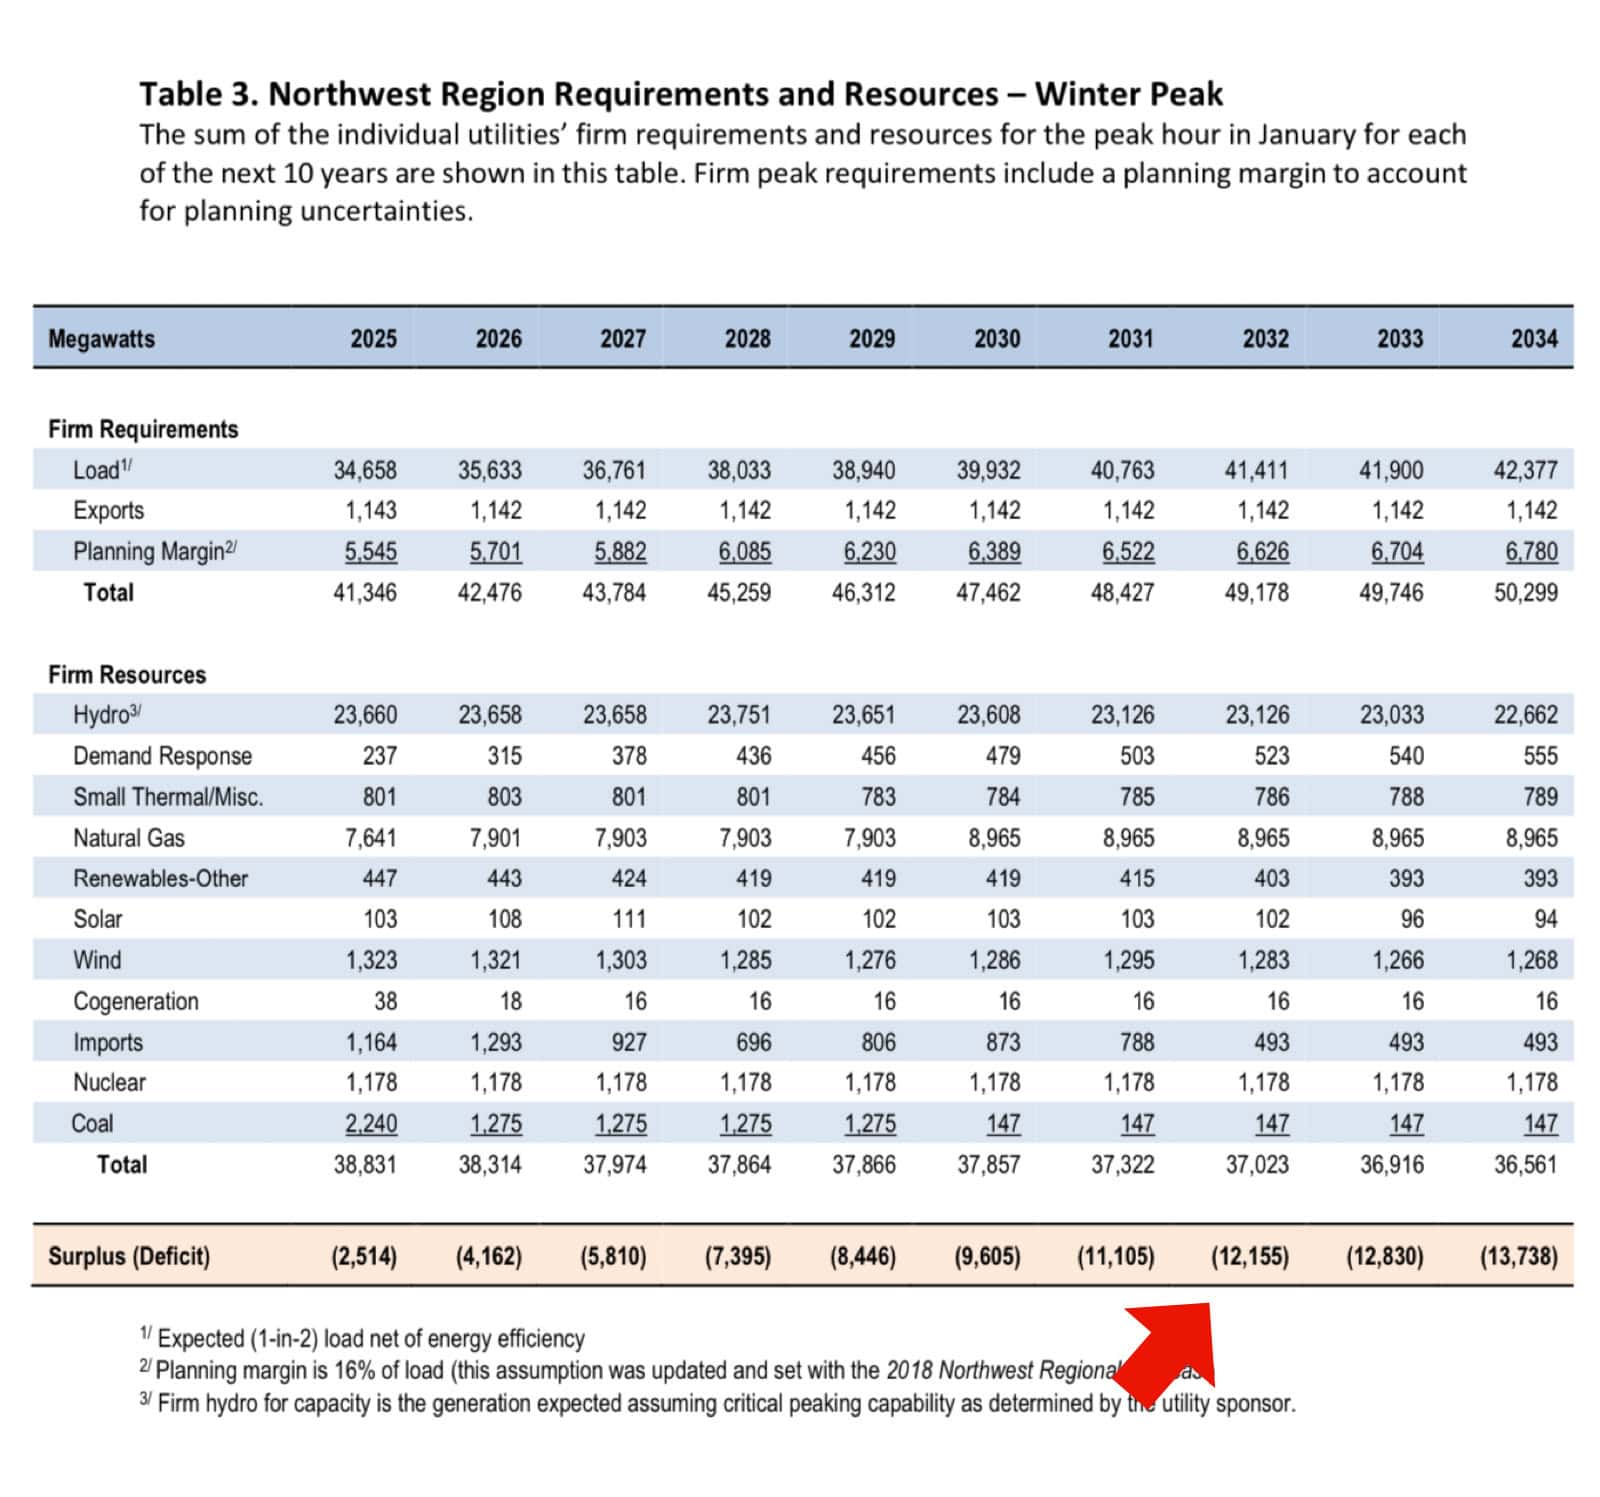
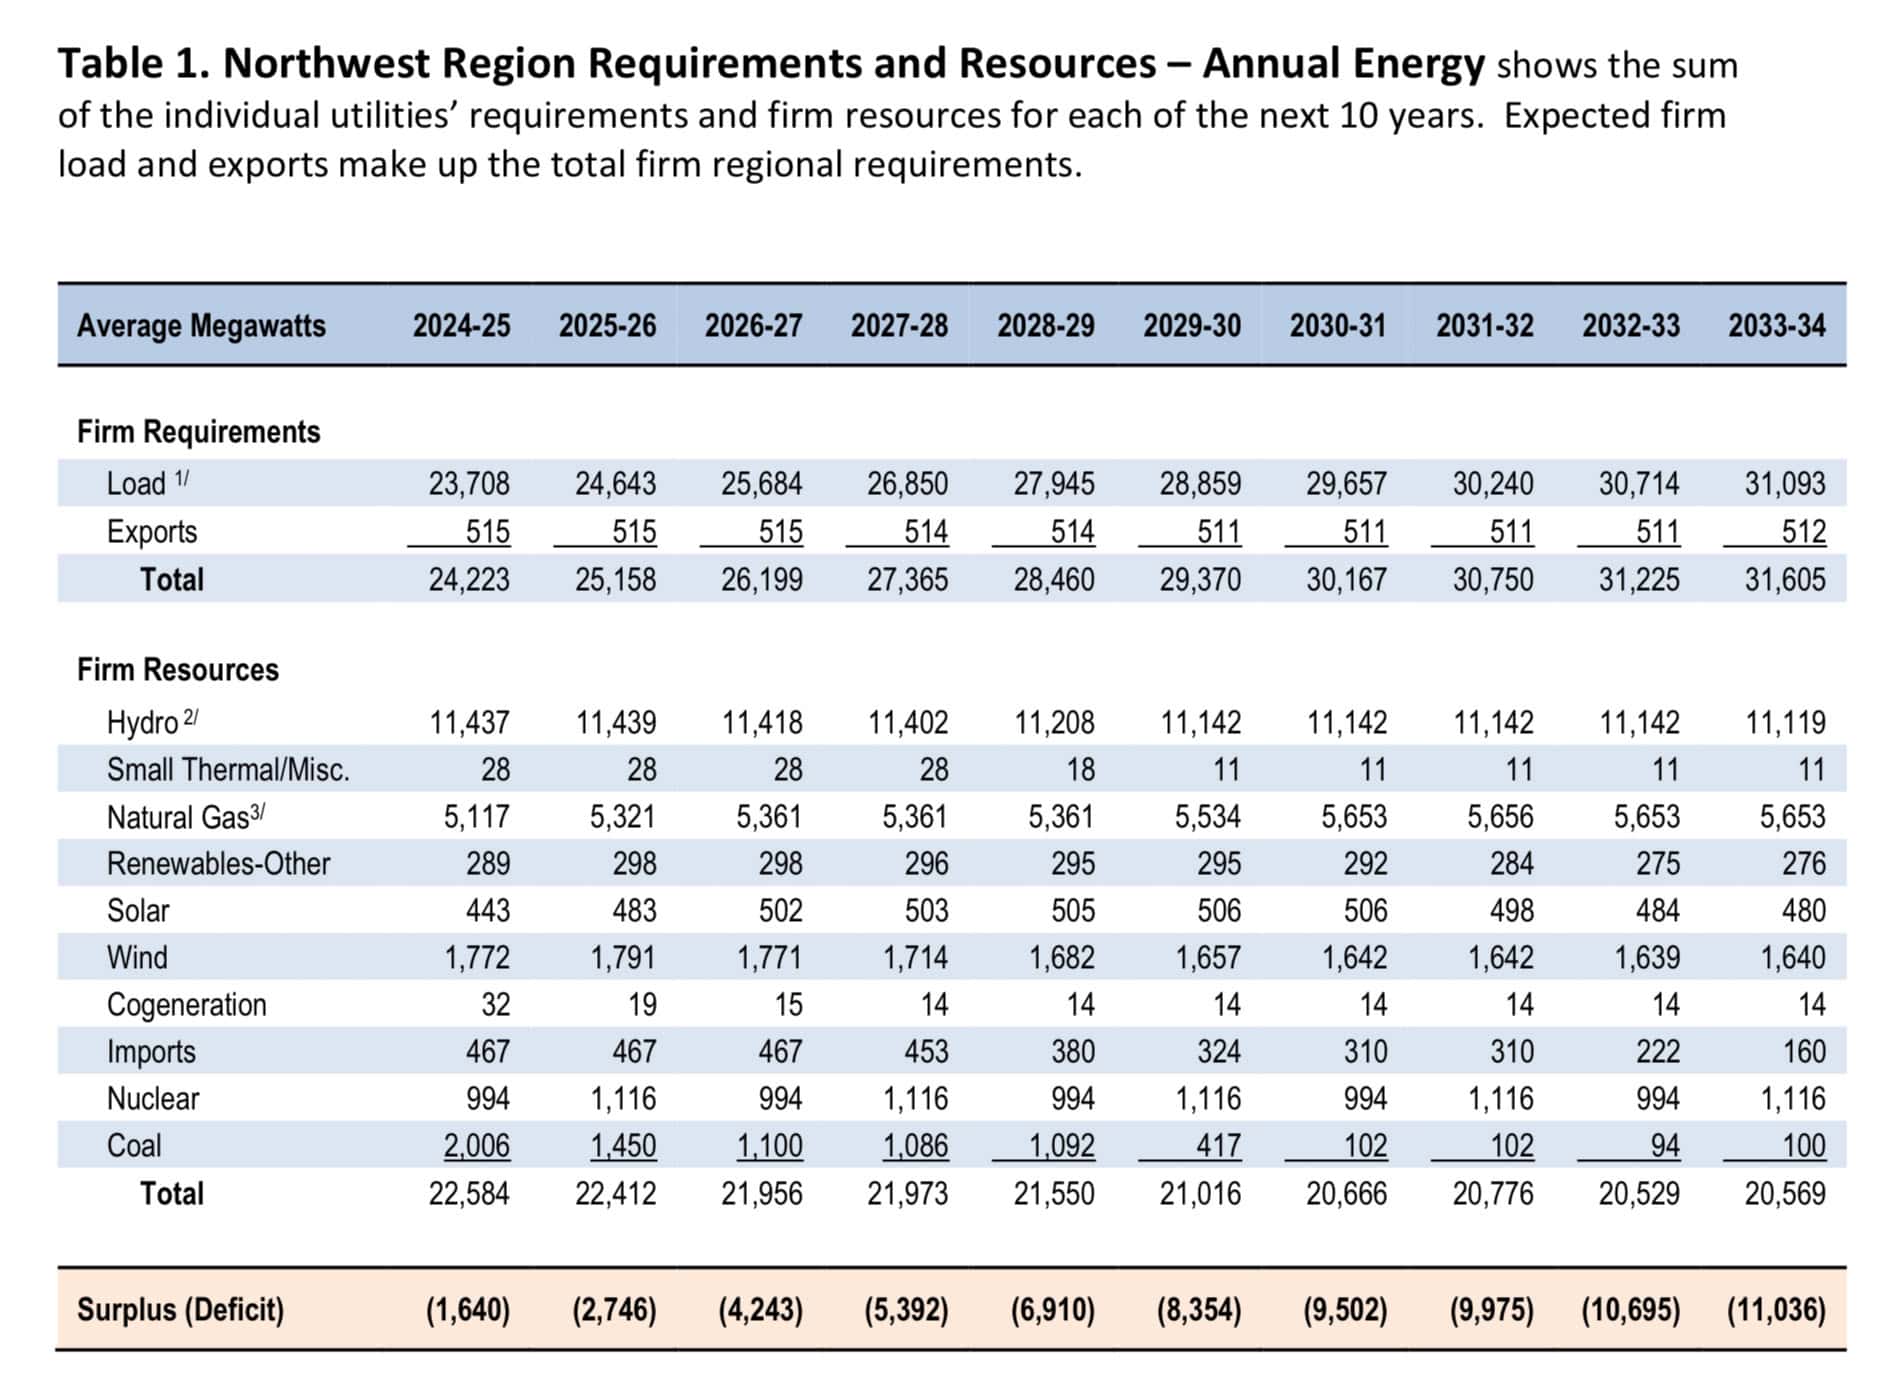
- The Pacific Northwest Utilities Conference Committee’s (PNUCC) 2024 Northwest Regional Forecast projects that demand for electricity in the Pacific Northwest could grow by over 30% in the next decade. The increase is attributed to factors such as data center development, high-tech manufacturing growth, and the continued trend toward electrification of heating and transportation.
- As with BPA, PNUCC’s recent studies estimate a need for 17 GW of new supply, but less than 1 GW is committed. The rest has not been funded, designed, located, purchased, permitted, passed legal challenges and court cases, etc.
- OPALCO estimates a 2035 supply/demand shortfall of 13 to 25 GW. The region’s existing 3 GW of wind power took 25 years to develop, and it would take over 200 years to develop 25 GW at that rate.
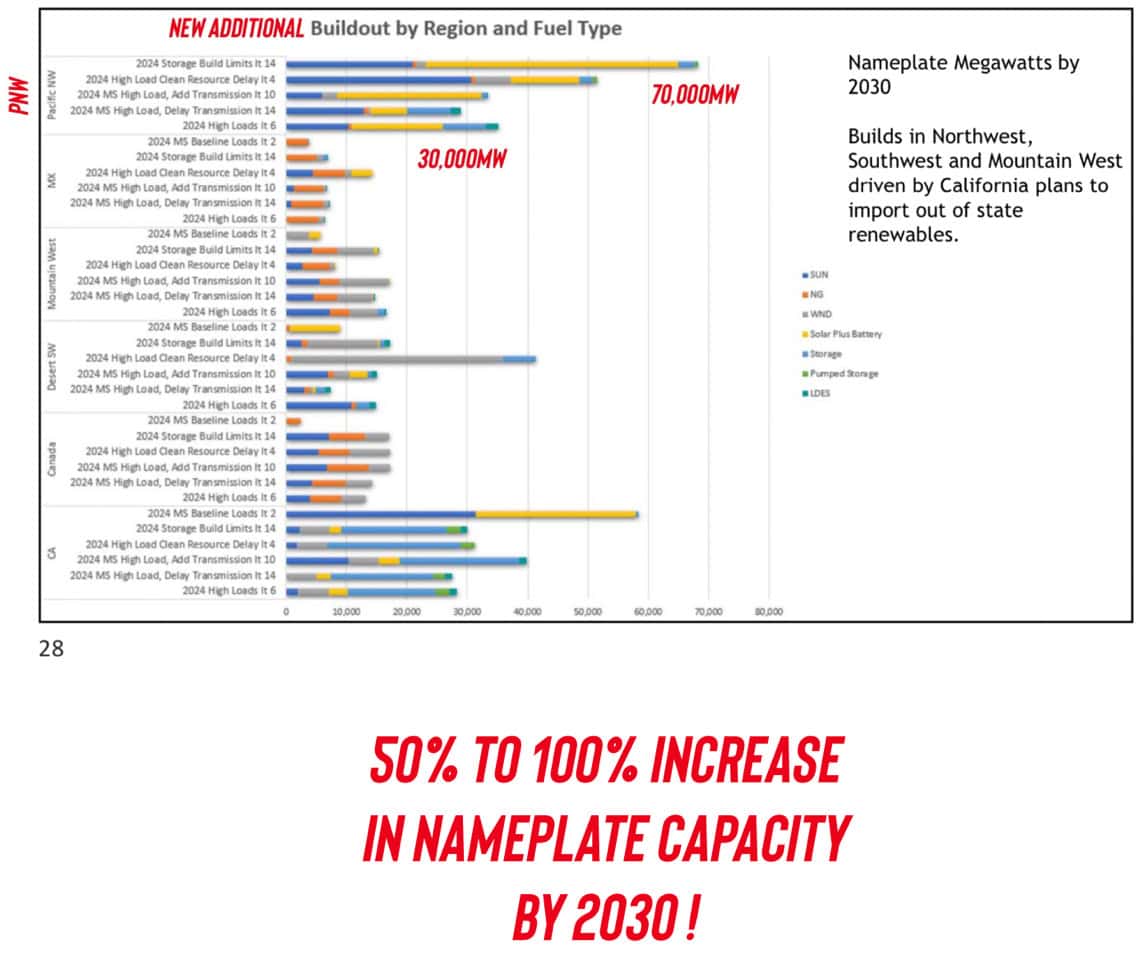
- To make matters worse, an August 2024 study by the NW Power & Conservation Council (NWPCC) estimates that 30 to 70 GW of new energy resources must be built out in the northwest by 2030.
- Across the western region, the NWPCC analyst noted, “We should expect our total build to be between 406 and 613 GW, which is astonishing! That is the biggest number I have ever seen.”
The increasingly important role of energy imports
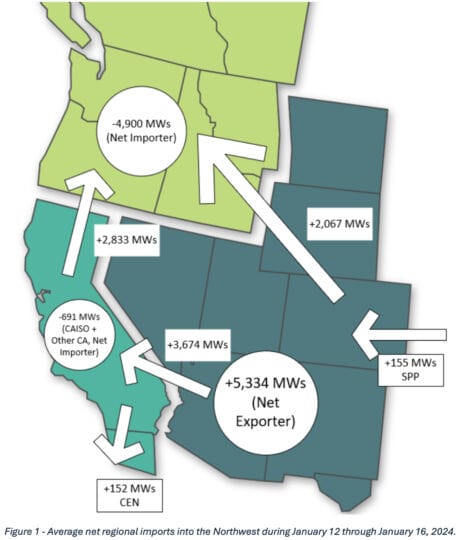
In addition to developing renewable energy generation capacity, Washington’s energy strategy relies on substantial energy imports from our Western neighbors.
As the picture at right shows, during the January 2024 cold snap, the hydro system was maxed out, and the northwest became a net importer of an average of 4,900 MW per hour during the five days from January 12 – January 16, 2024.
The conditions experienced from January 12 through January 16, 2024, highlighted a tipping point and demonstrated how close the region is to a supply/demand crisis.
Some have called for the northwest region not to share its coveted hydro with our neighbors. This would be disastrous. As the energy supply/demand crisis deepens and climate extreme weather heat domes and cold snaps accelerate, we are synergistically stronger together, working with our neighbors, who each have unique clean energy resource strengths to share when neighbor states are in need, e.g., California solar, BC hydro, Idaho wind.
How is OPALCO preparing for mainland outages?
Major mainland power outages are imminent and projected to happen more often, especially in summer, during heat domes, and in winter, during cold snaps. To prepare for this, OPALCO has three major initiatives:
- Develop as much Community Solar as members want. In the sunny season, as little as 135 acres on four islands could power the county by 2030. The solar systems would track the sun, providing more output in winter than conventional member rooftop solar. These systems would also be configured with battery storage to support critical services during outages.
- Pilot test tidal energy to help meet winter load. Member load doubles in winter, but solar is minimal. Tidal energy is strong year-round. OPALCO has received a DoE grant to plan how to provide tidal energy in the county in an environmentally sound, reliable, and cost-effective way.
- Support rooftop solar with the Switch It Up program. Rooftop solar is an important summer energy source and helps reduce summer load, however it doesn’t work during outages. In winter, rooftop solar only serves a tiny portion of the load.
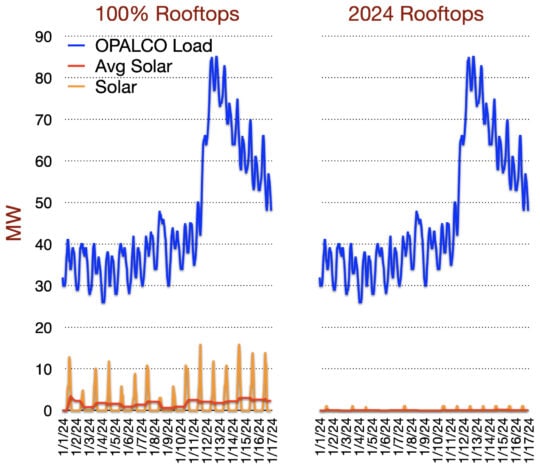 The two charts at right show solar production if 100% of members had rooftop solar (left chart), or just the 2024 solar member production (right chart), at the time of the cold snap. The blue line is OPALCO load, peaking as the cold snap set in. The orange line represents the amount of rooftop solar energy being produced. The red line is the rooftop solar output, if there was a battery to smooth the energy for use both day and night.
Taken together, these three initiatives will:
- Reduce our dependence on the mainland for energy.
- Help the county survive mainland power outages.
- Help the state meet its enormous need for clean, renewable energy, by generating locally, freeing up mainland generation to help others.
There are no perfect solutions or easy answers. Business as usual is not a plan. Many community energy projects throughout the US are canceled due to local opposition. We are all in this together. This can only be done with the support of co-op members who support local energy and reducing our dependence on the mainland.
Learn More
Seattle Times: Forecast is clear: WA must boldly pursue new green energy sources
“Washington state is taking pains and bold steps to cut carbon emissions, as climate change accelerates. Those laudable goals are now challenged as new demands for electricity are surging. That growing paradox — a higher load with a lower supply to meet it — will send energy costs higher for residents around the state, and worse, holds the potential for blackouts if the electricity grid is overwhelmed. Leaders must double down on development of green energy sources to maintain grid reliability.”
The hard stuff: Navigating the physical realities of the energy transition
“Only 10 percent of the low-emissions power capacity needed by 2050 to meet global climate commitments is currently deployed. Navigating the remaining 90 percent requires confronting the reality that the energy transition is at its core a physical transformation—on a colossal scale.”
PNUCC Northwest Regional Forecast
The BPA transmission plan is often cited as evidence that many projects “In Progress”. Referring to the chart below, in progress just indicates potential projects. Most are withdrawn as developers get into the actual complexities of development, facing regulatory, financial, or construction hurdles before they can be realized and contribute to the grid. Nationally, about 70% of these sorts of projects are canceled due primarily to public opposition.
PNUCC Northwest Regional Forecast of Power Loads and Resources
August 2024 through July 2034
NWPCC Wholesale Power Price and Avoided Market Emissions Rate Forecast
August 2024
