Board Perspective on Rates and Finance
Board Perspective on Rates and Finance
Jim Lett, Board President
September 9, 2015
Dear Co-op Members:
The following thoughtful analysis of OPALCO’s rates and revenue situation was initiated by our Shaw Island board member, Dr. Jerry Whitfield, who brings significant expertise in business and financial matters. This letter has been reviewed and edited by the full board to reflect our position as a whole in the hope that we can bring greater clarity and understanding to the membership about our financial position.
Summary
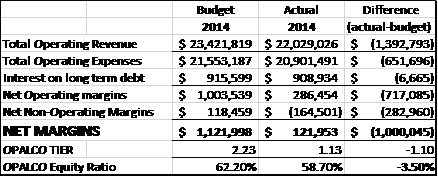
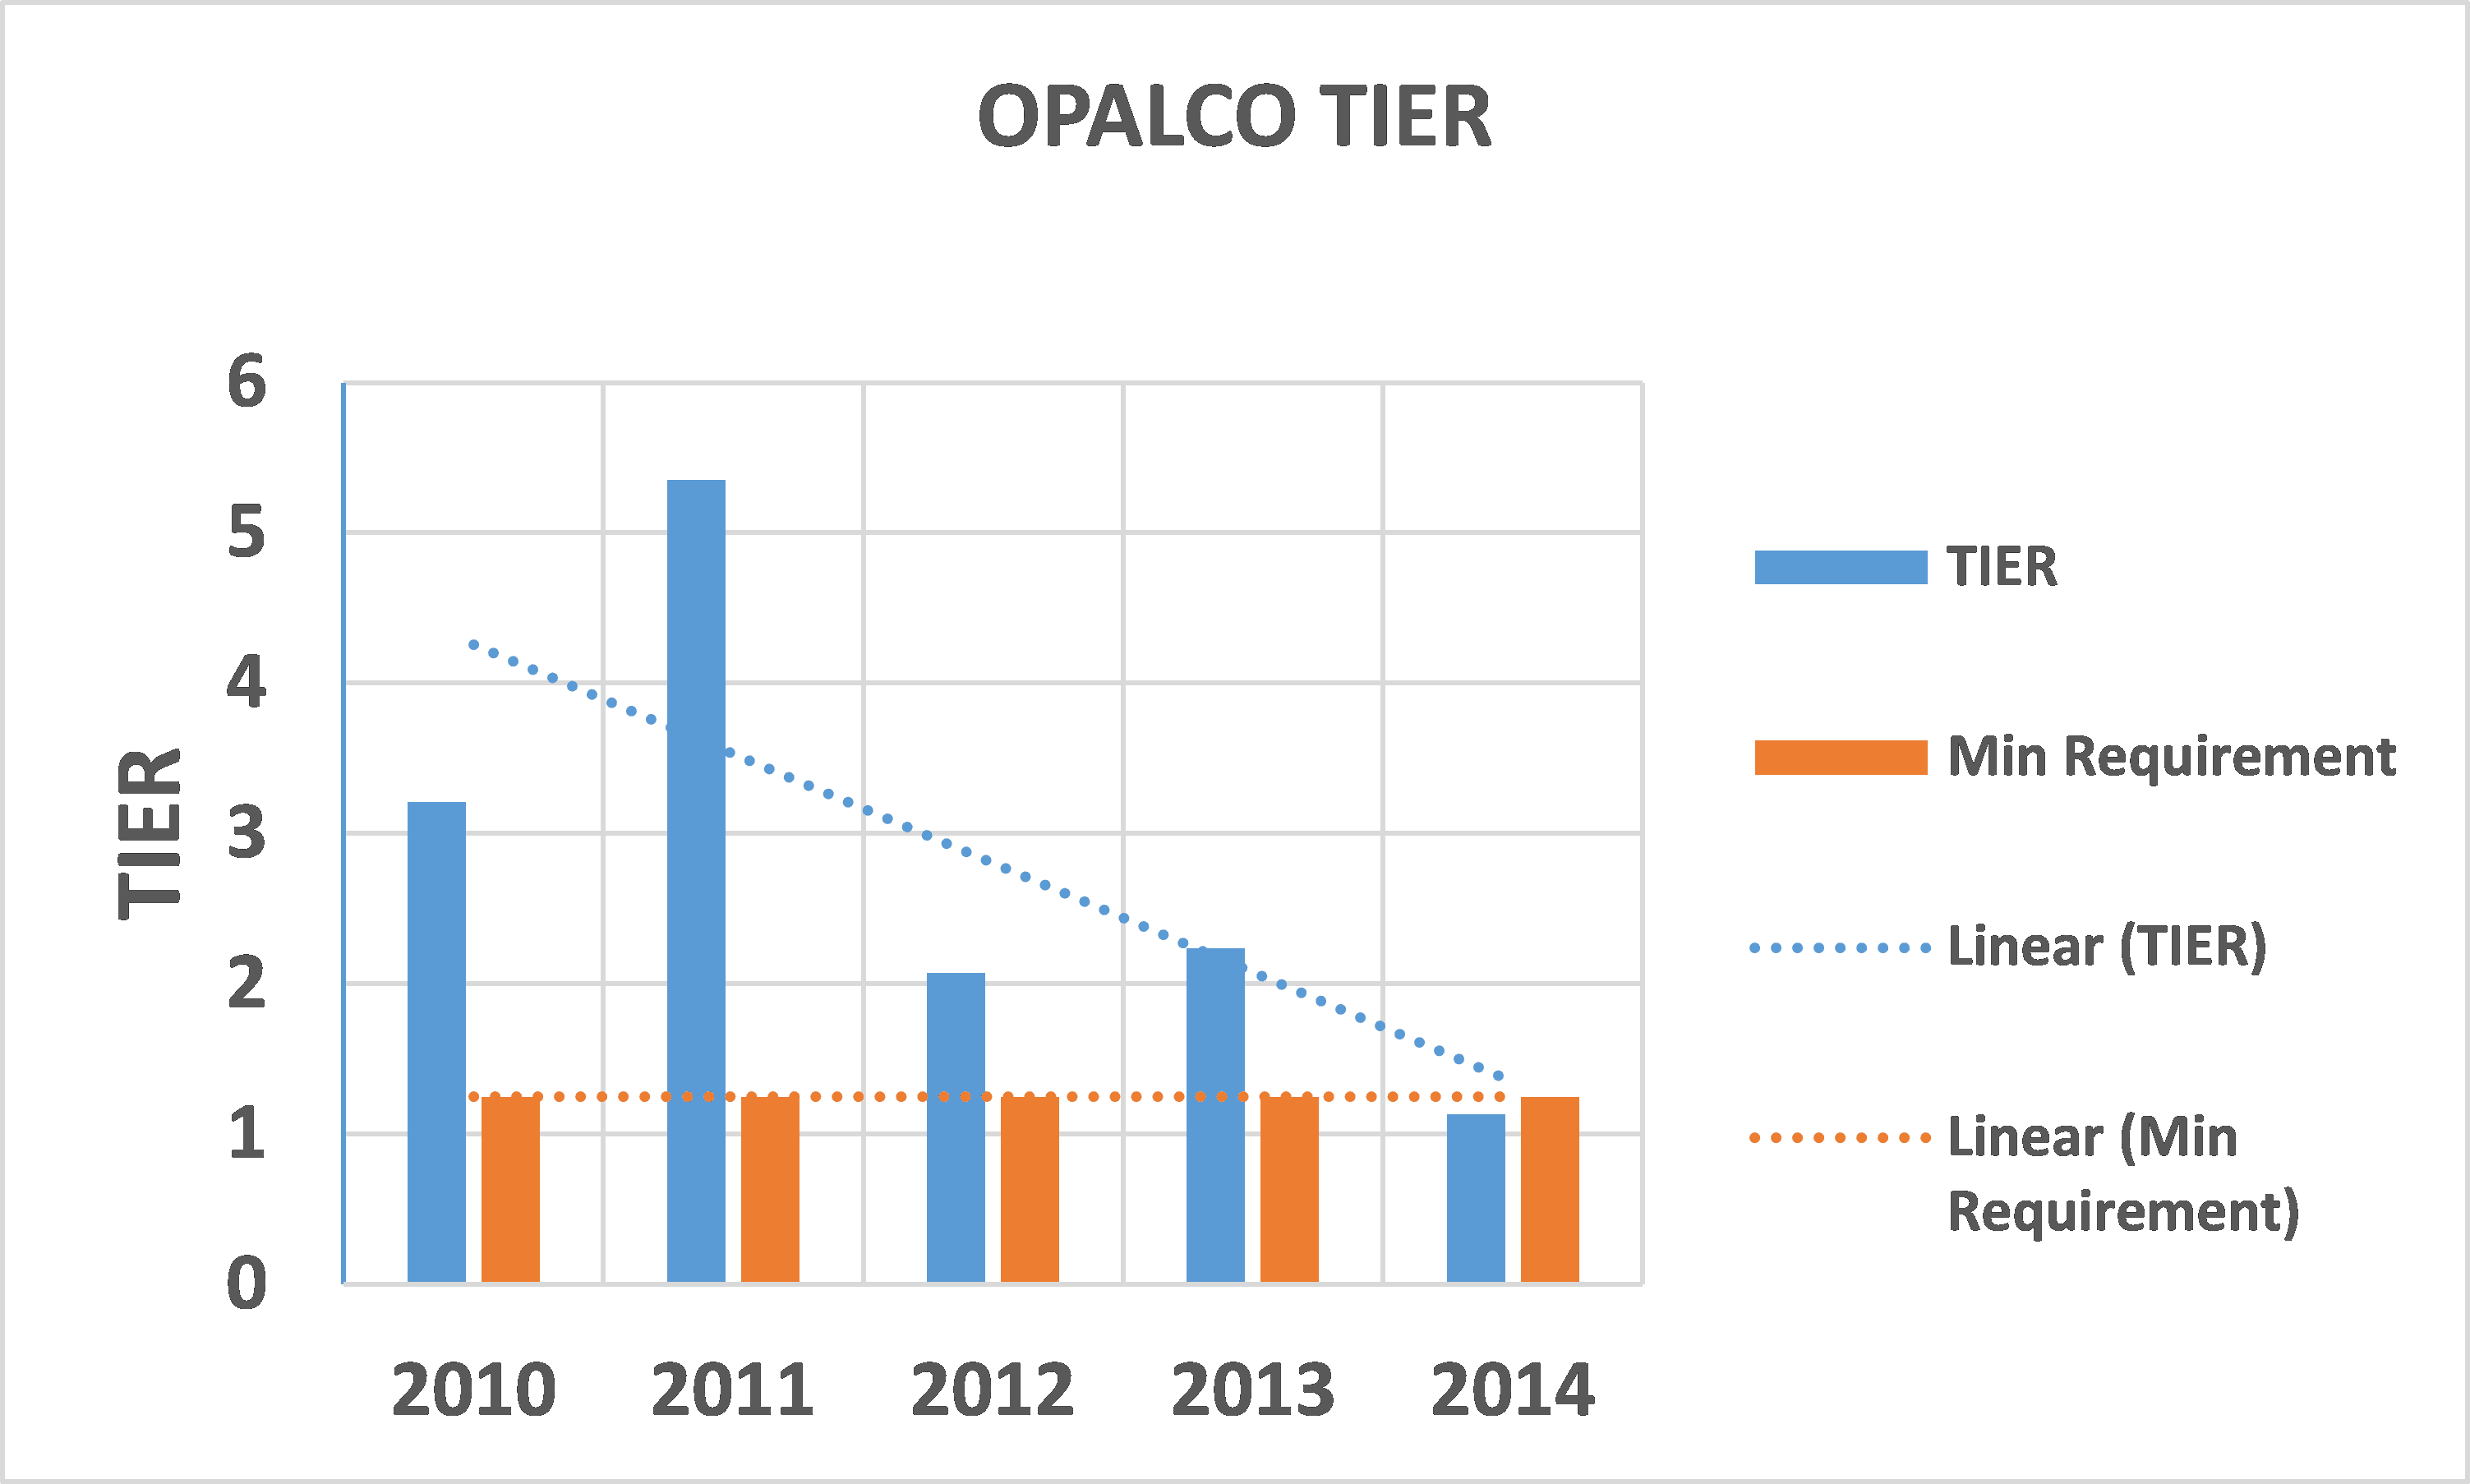
OPALCO experienced a significant shortfall in revenue during 2014 that was 6.0% below budgeted “cost of service”[1] that is continuing in 2015. The Cooperative’s bottom line, or Net Margin, was down by $1.0M in 2014, which put the Co-op’s key TIER[2] ratio below the minimum required in its loan covenants (see table below). This requires a corrective action plan to be filed with OPALCO’s lenders. Recently, the Board approved a temporary charge on all residential and commercial electric bills through the end of 2015 to recover the expected 2015 shortfall in revenue and to restore TIER to above the required level. The underlying reasons for this revenue shortfall, the impact on member’s electric bills, and a process for finding solutions are examined here for the benefit of all members.
Background
An electric cooperative is a not-for-profit, membership-owned, quasi-monopoly. As such it is required to provide an exclusive electric service to all its members at its “cost of service.” This means that it must charge a price for this service that covers all of its actual operating expenses plus a small margin (Net Margin), typically 4-5%. This margin is not considered profit in the strictest sense but is used to build up “patronage capital” for each and every member which is repaid to members after 25 years of service.
Obviously, revenue shortfalls are bad financially for any organization. OPALCO relies on long-term, low-interest government loans administered through the Department of Agriculture to provide and maintain the infrastructure that delivers electricity to our homes and businesses. OPALCO services these loans through revenues collected from members of the cooperative when they pay their electric bills. If these revenues continue to fall short, OPALCO will continue to make adjustments as required in the corrective action plan to meet our revenue requirements and avoid risking default on its loan covenants that are designed to assure the lender of OPALCO’s continued ability to repay these loans.
To meet its loan covenants, OPALCO must maintain its Net Margin at a level that is at least equal to 25% of the interest it must pay on all of its outstanding loans, (TIER=1.25). In 2014 TIER dropped to 1.13, or 13% of its interest repayments, requiring OPALCO for the first time ever to provide its lenders with a recovery plan. Please note that OPALCO remains in loan compliance as TIER covenants are measured via a three-year rolling review.
Revenue Shortfall
How does OPALCO set its rates and how has this revenue shortfall occurred? OPALCO, along with its professional rate consultants, EES Consulting, undertake a Cost of Service Analysis[3] to develop a “rate structure” that is designed to generate revenues sufficient to recover OPALCO’s full cost of providing its service. A rate structure is also intended to fairly allocate expenses in relation to each member’s use of and impact on the system, to reduce the impact of weather variations, market and other volatility, and promote OPALCO’s financial stability. The Cost of Service Analysis utilizes OPALCO’s annual budget (projected revenues and expenses) as well as its load forecast (estimate of future electricity demand by all members) to develop electricity rates. The cost of service line items are clearly delineated each year in the annual budget. Still, the current rate structure did not meet its objectives for generating the revenue required to meet its cost of service. How so, and how can it be fixed?
Forecasting energy usage is not an exact science and a small variance can make a big difference. Our margin of error for weather prediction (heating degree days) is typically +/- 5%. In 2014, actual variance was 6%.
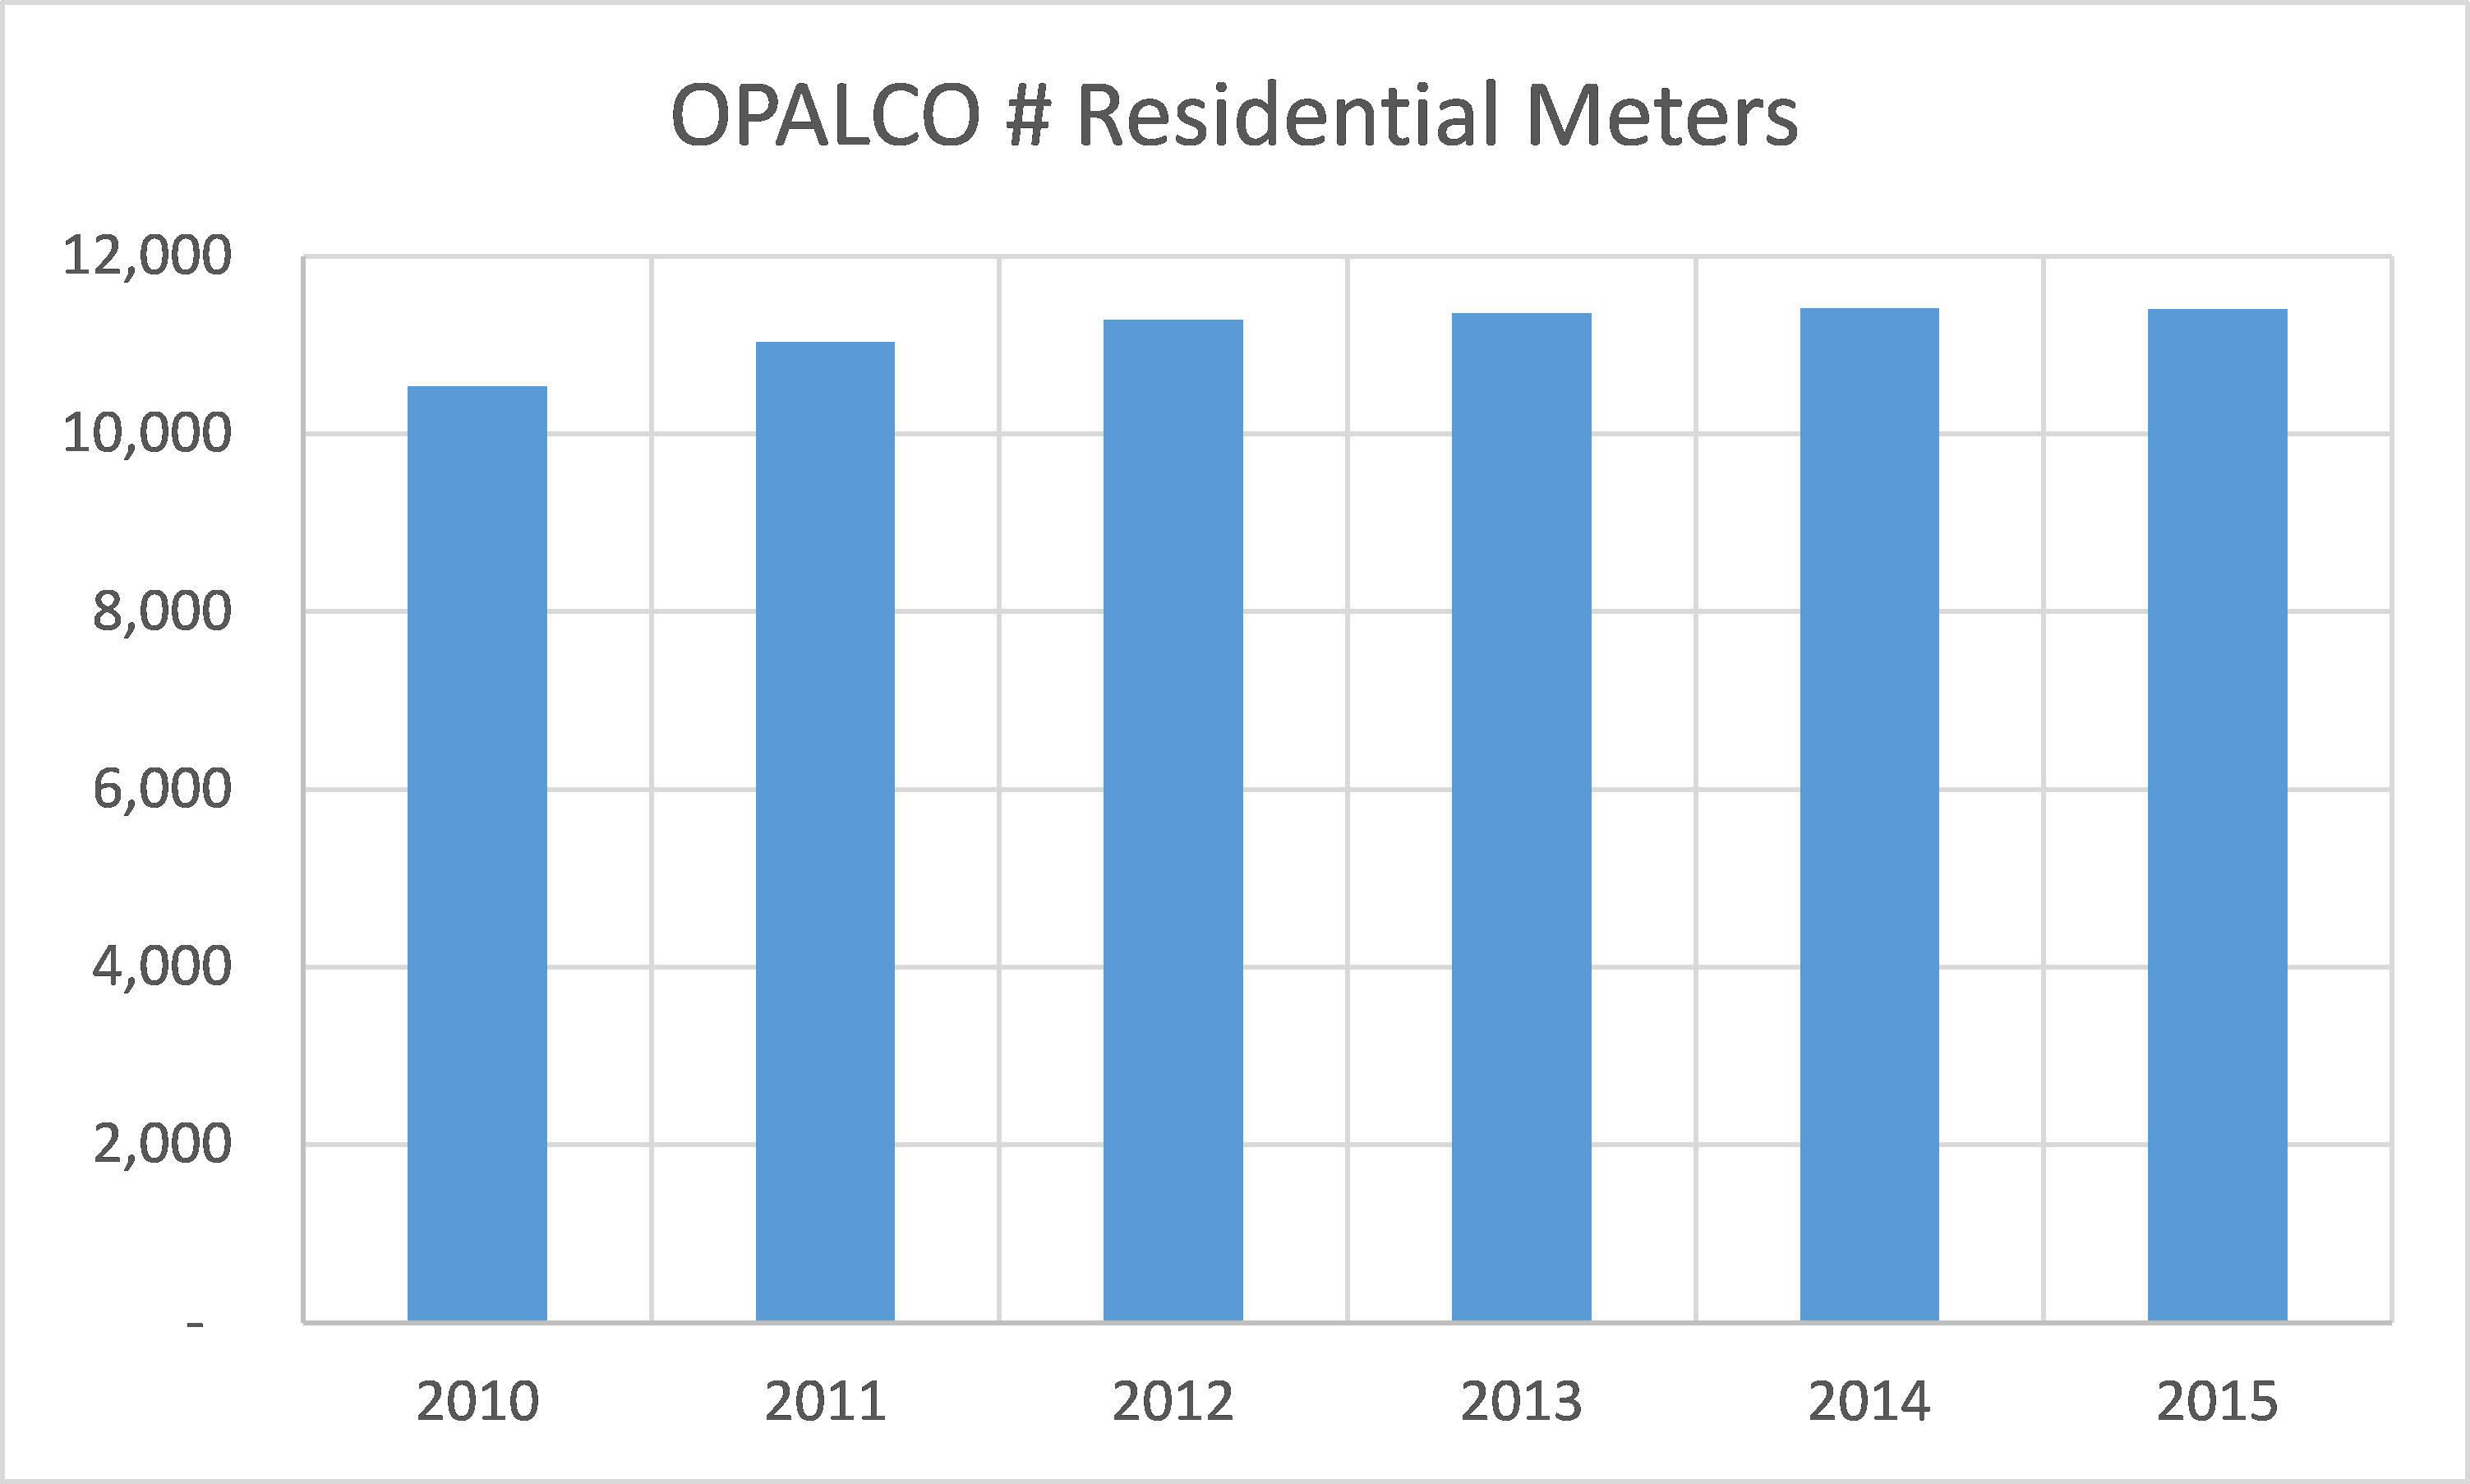
In the last 2-3 years there has been no growth in the residential customer base, and average customer usage dropped by 5% in 2014 with a steeper decline in Q1 2015. Usage is expected to decline through the rest of the year with another projected warmer winter.
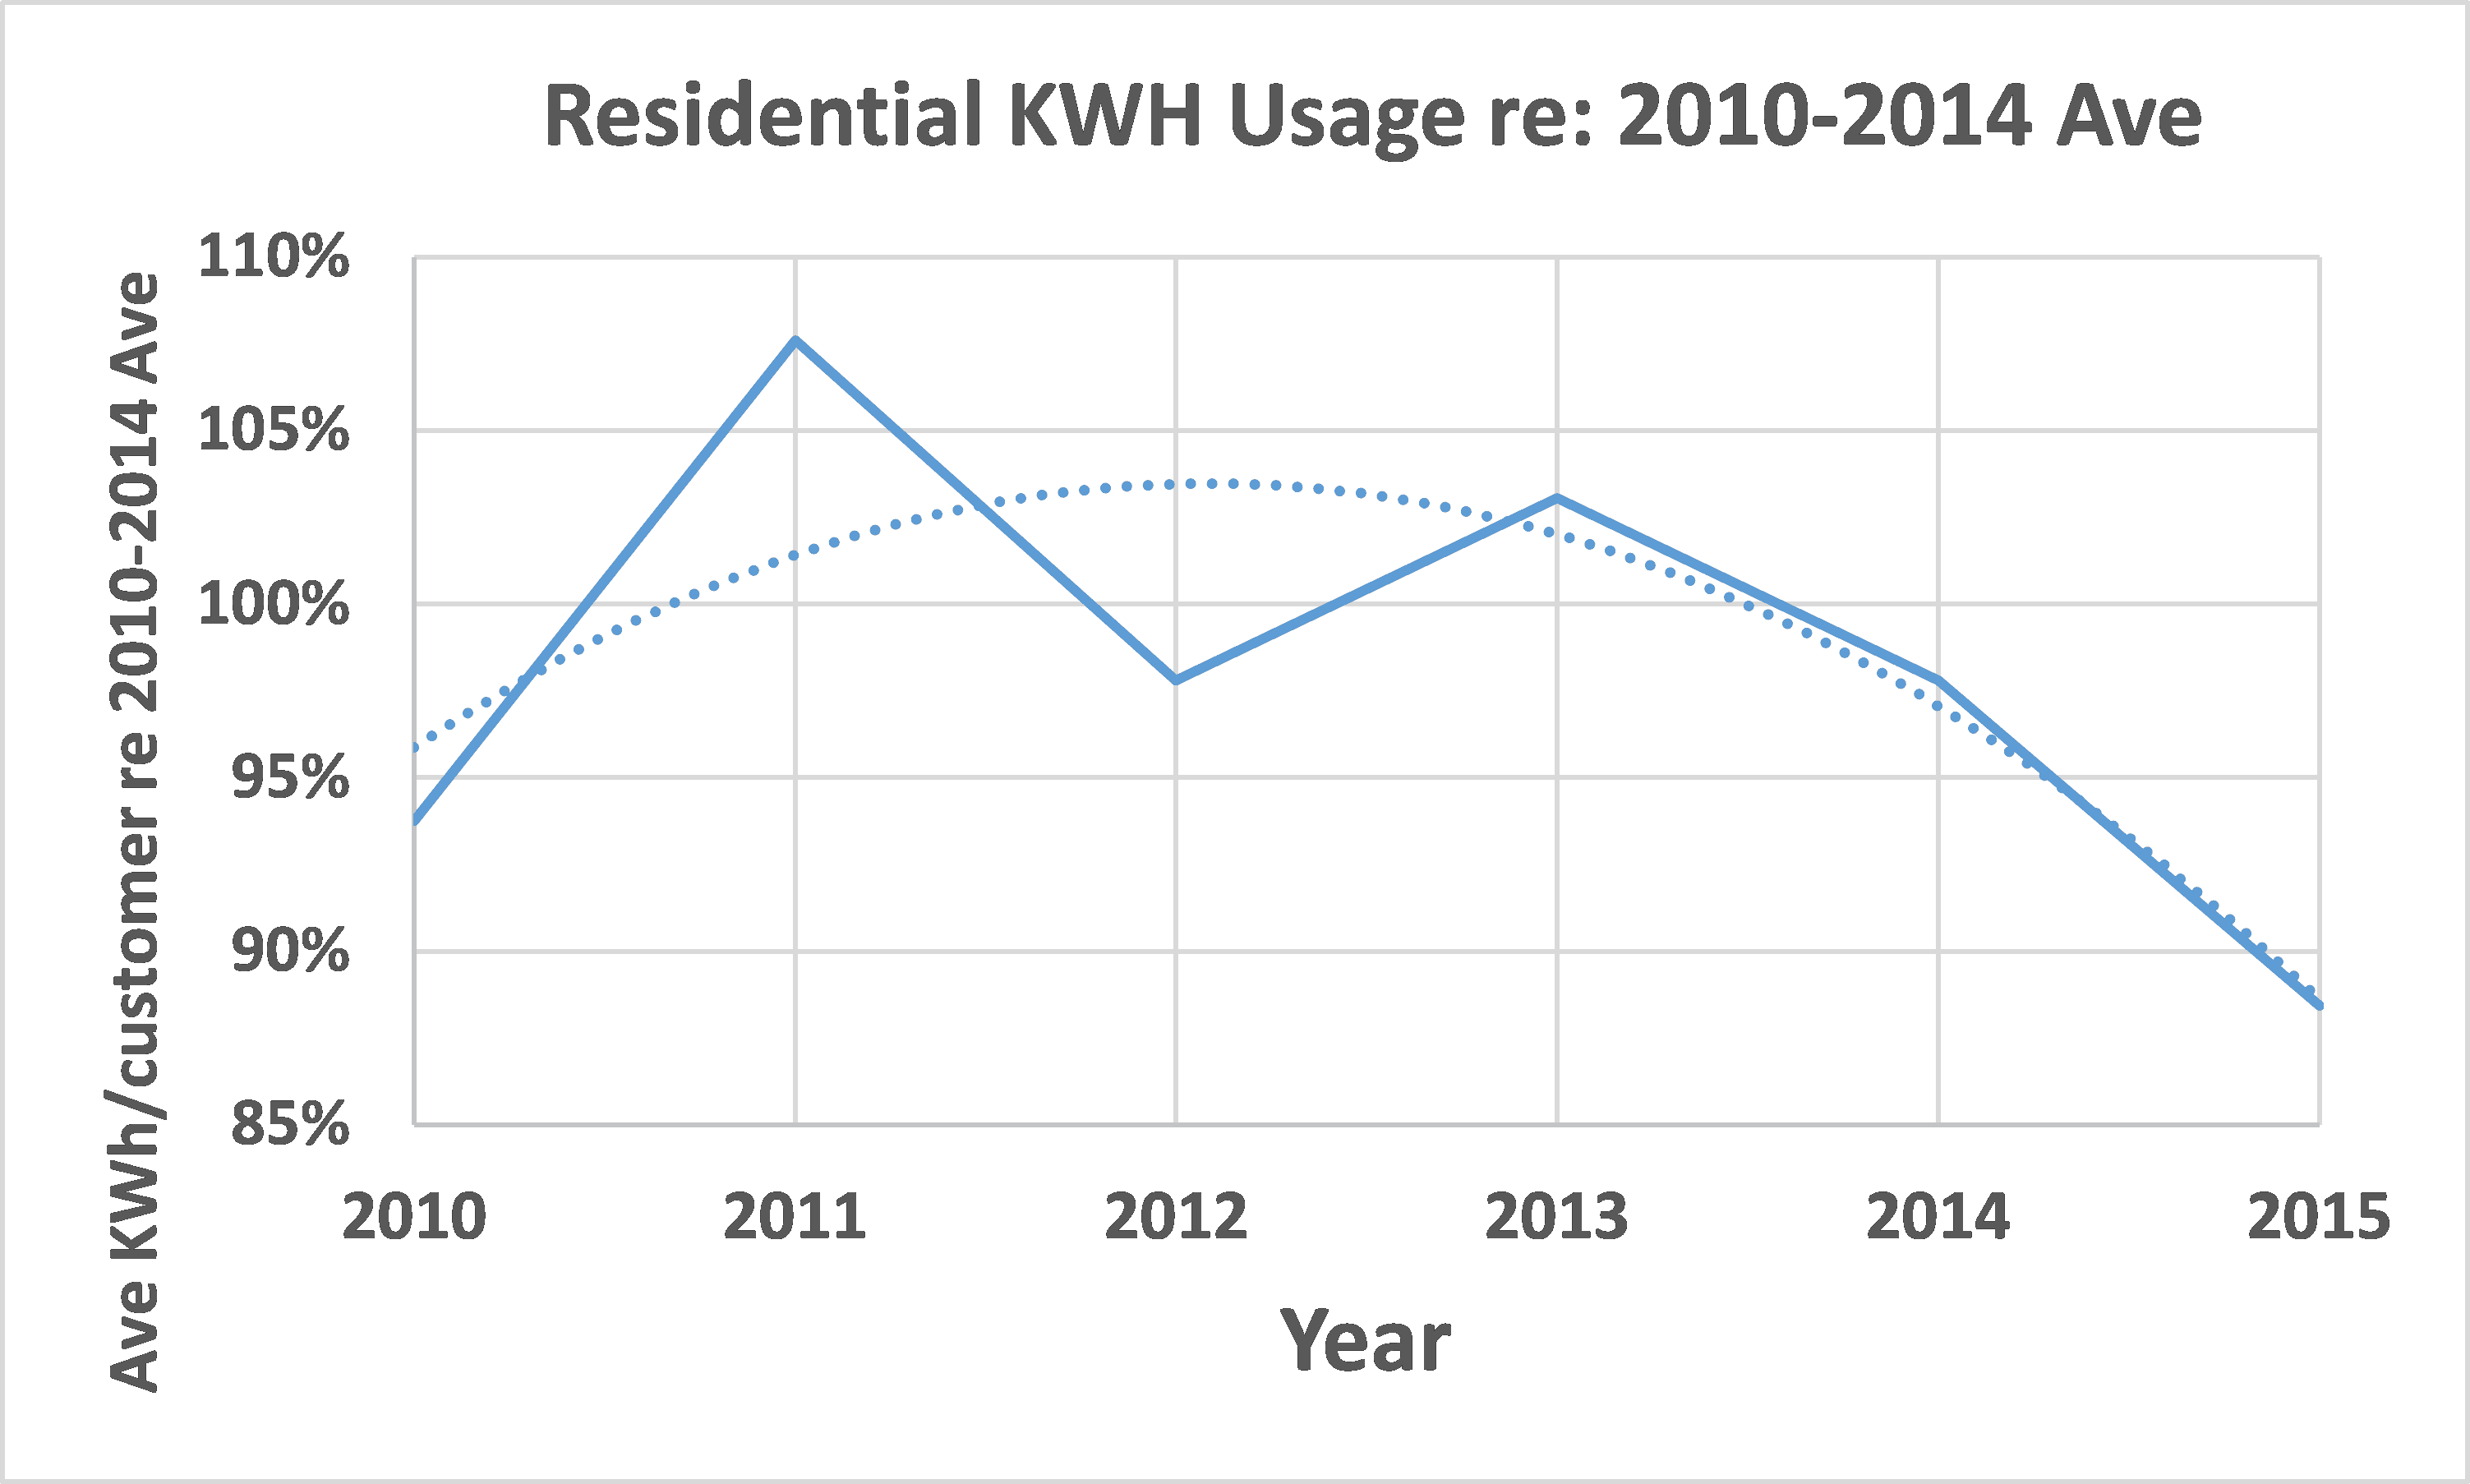
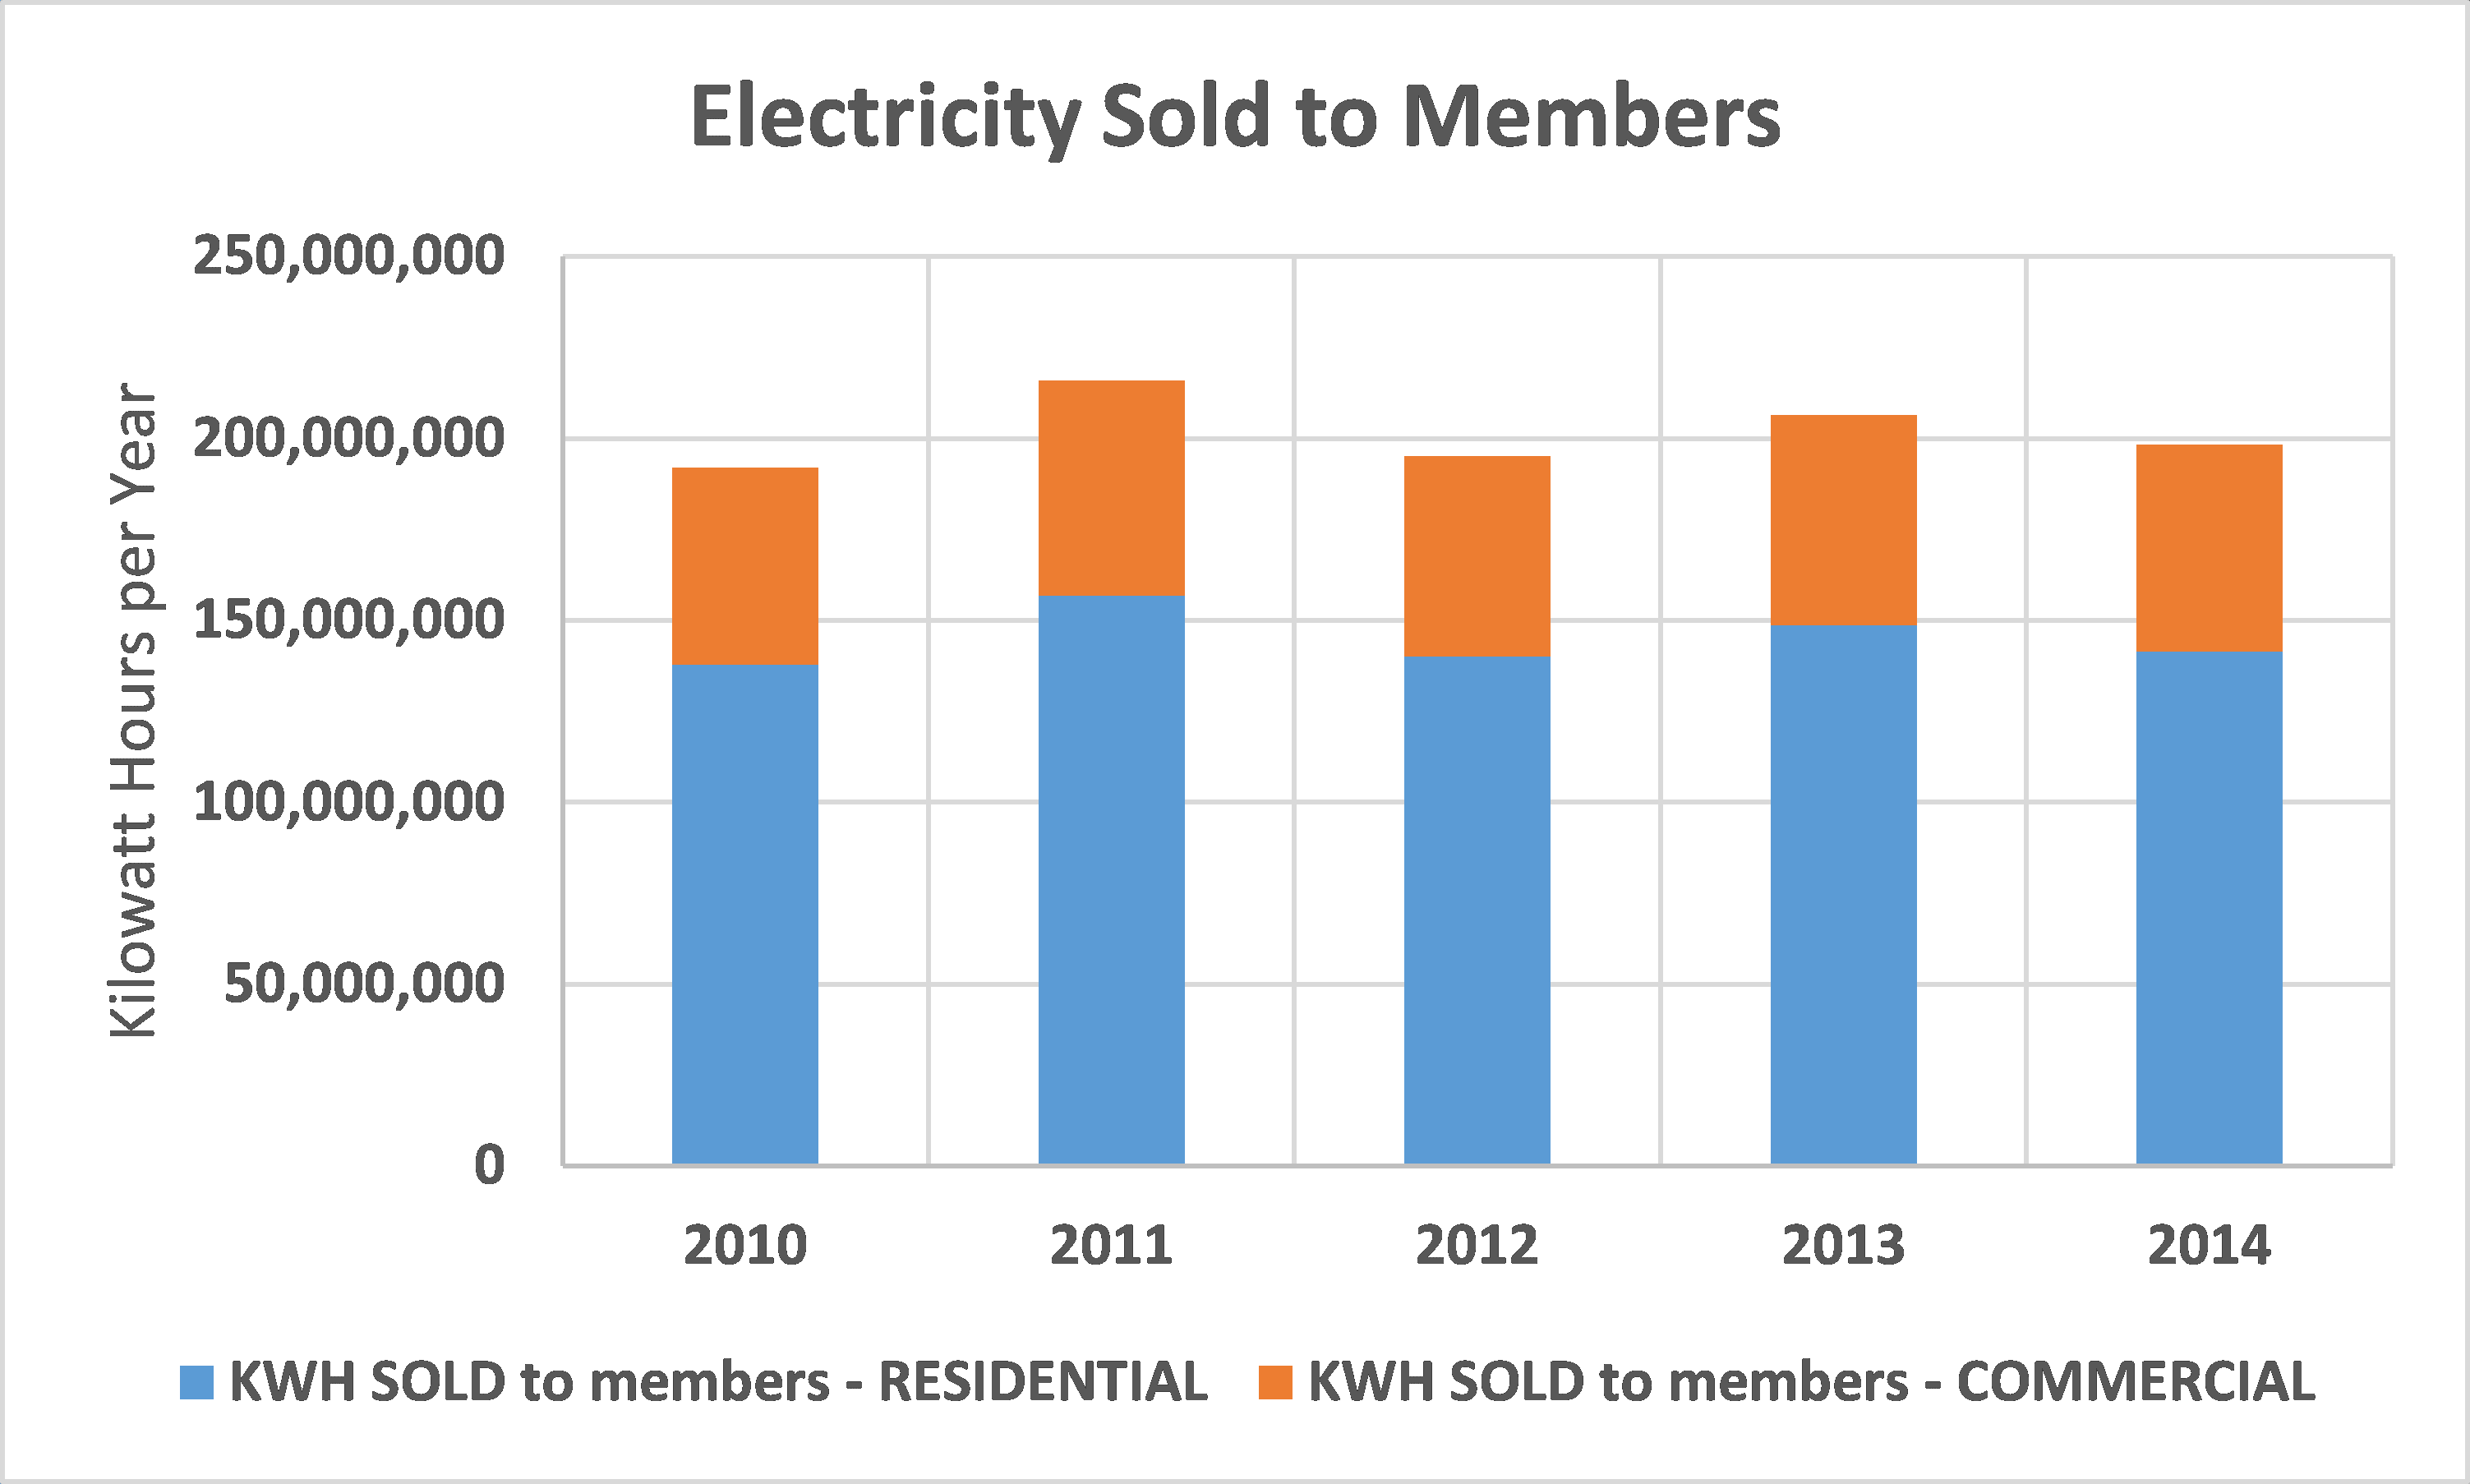
However, the cost-of-service analysis projected a 1% annual load growth in both 2014 and 2015, over-predicting sales of KWh by >6% in 2014. The $/kWh rate was established on this load projection, and when usage comes in low, so does revenue, which leads directly to the revenue shortfall. The net effect is that OPALCO has charged all members below the full cost of service during this period.
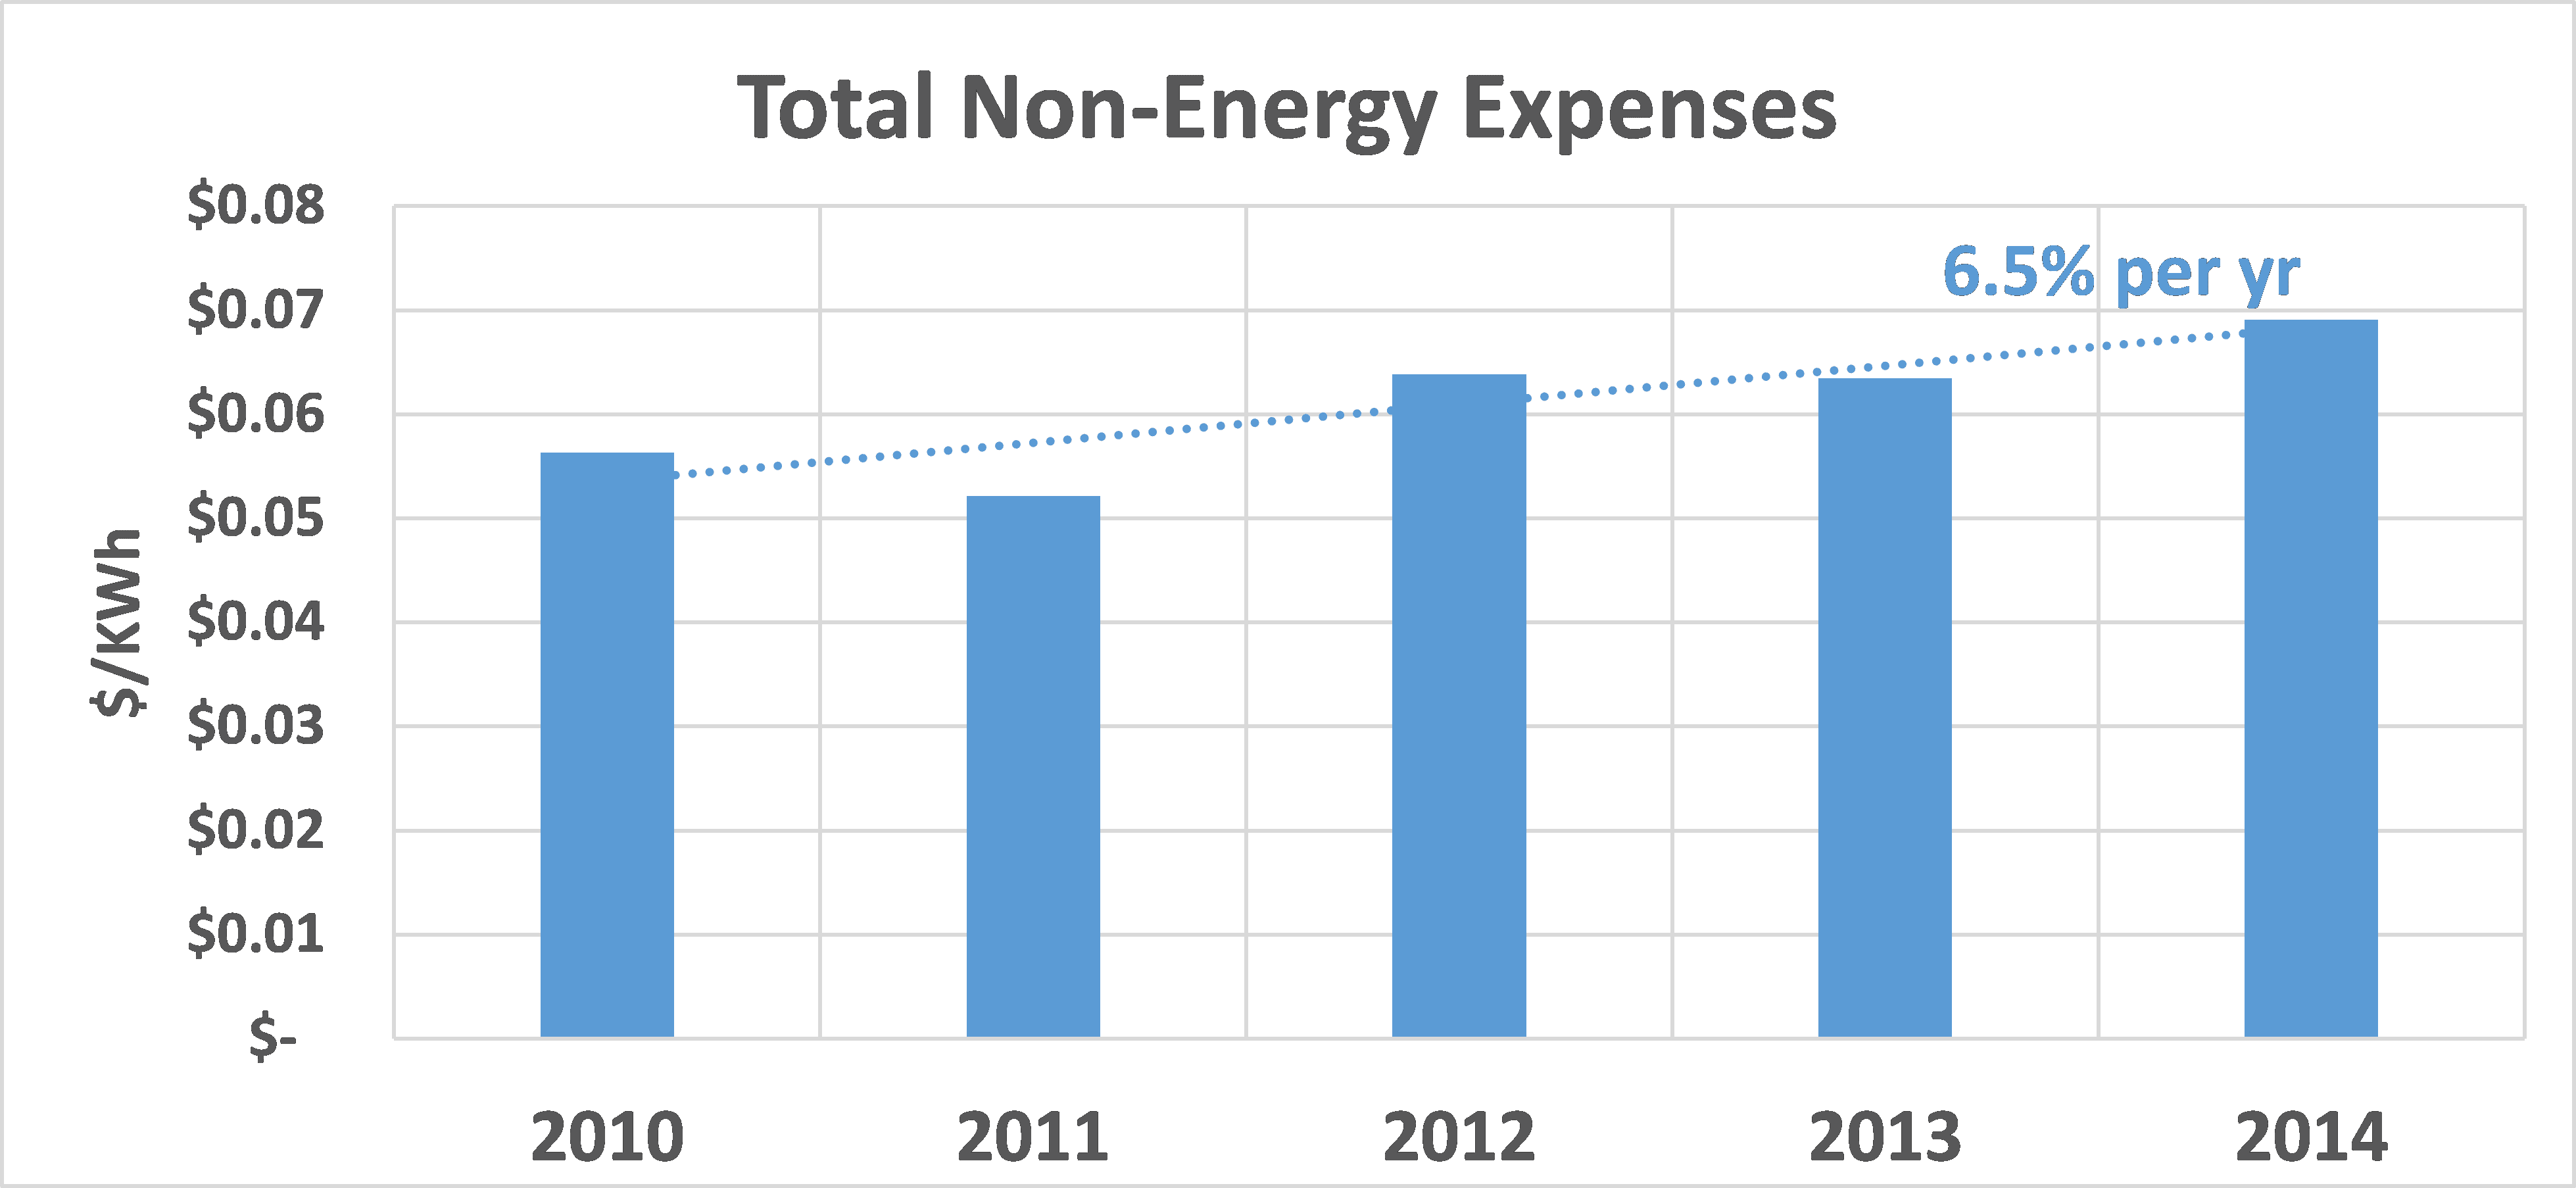
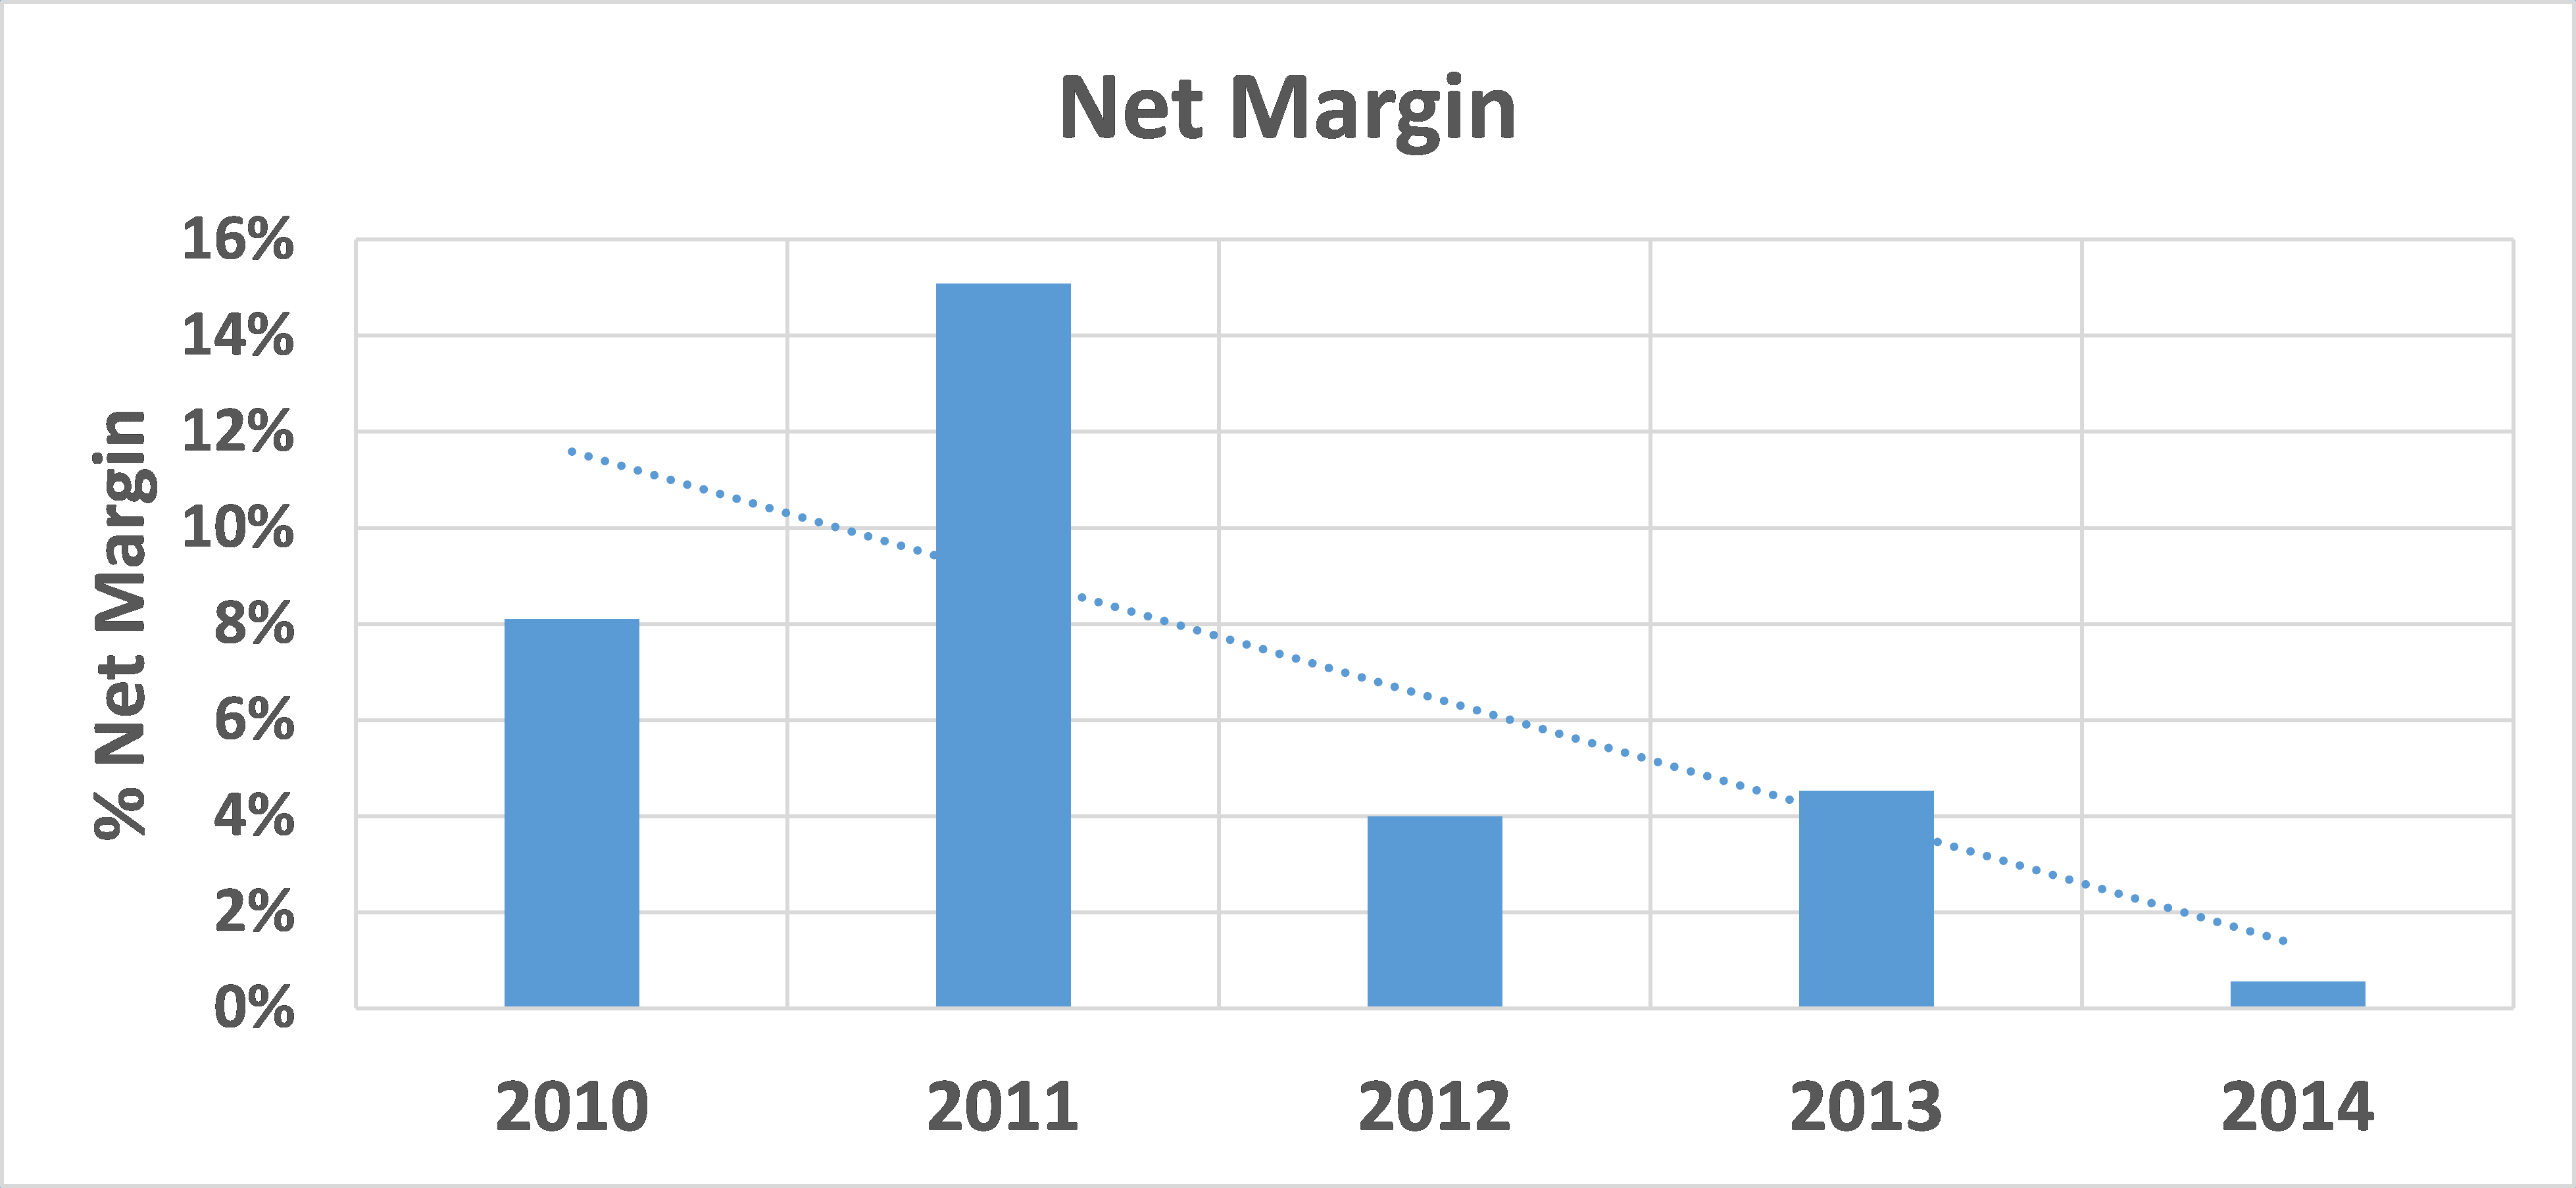
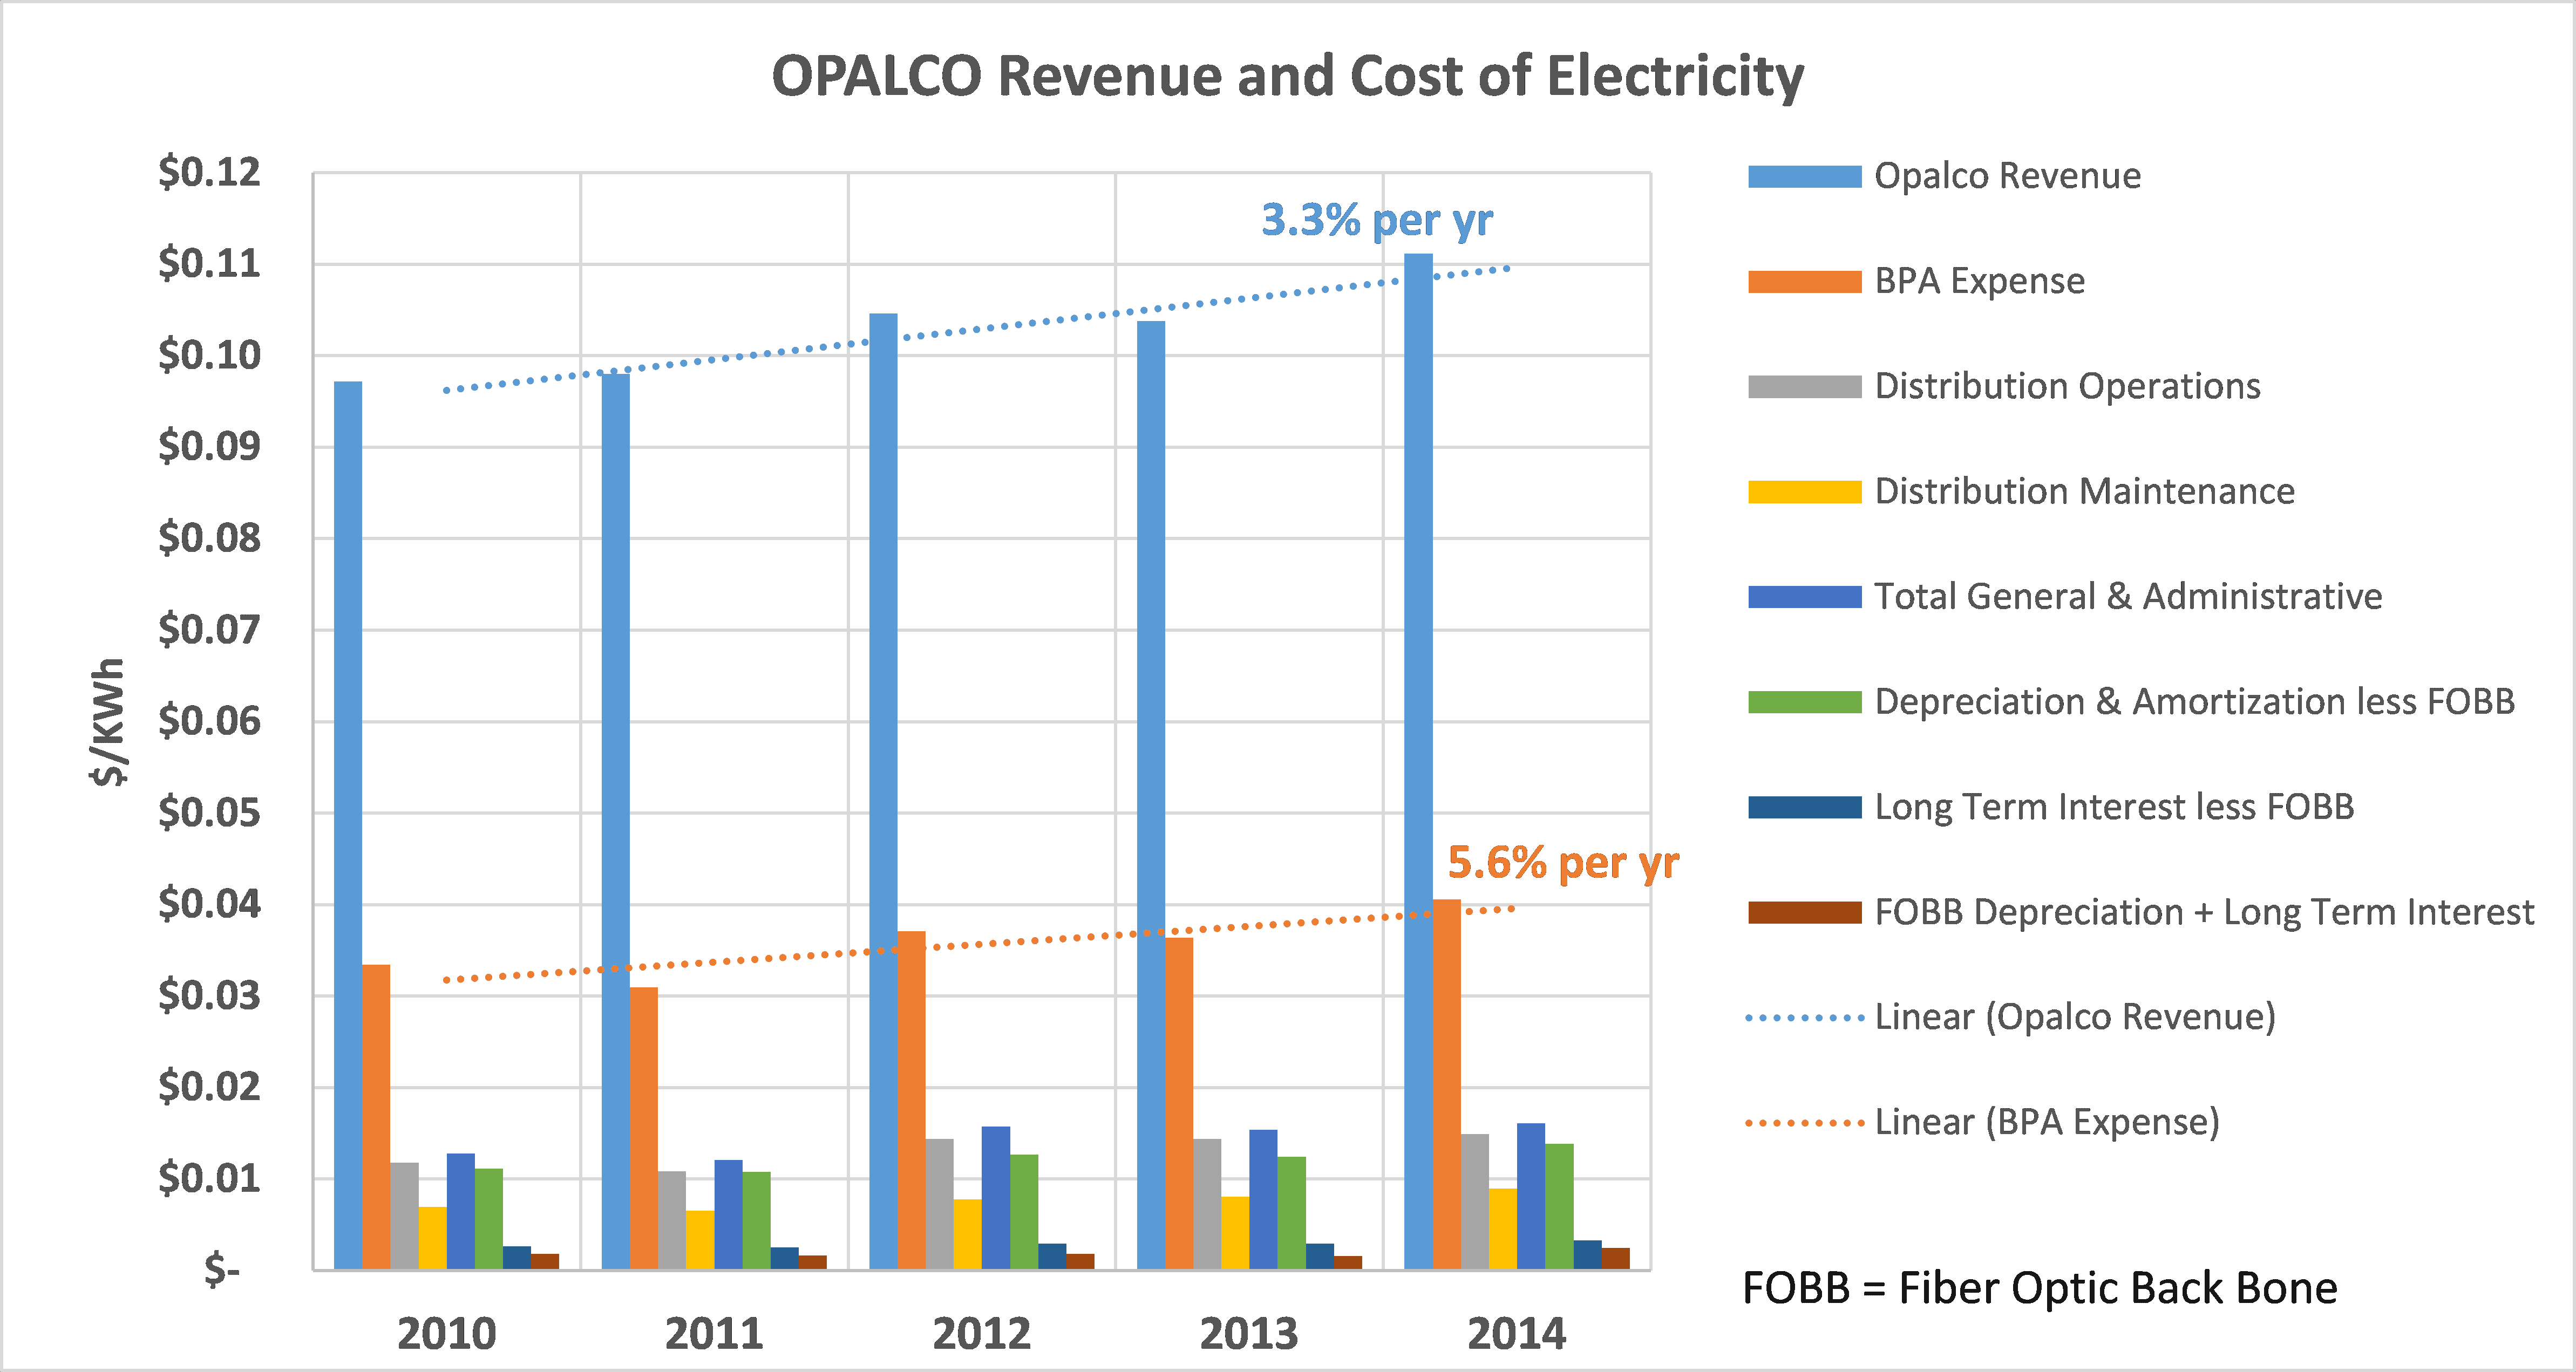
This trend has been in the making since 2010 (see charts below) because rates were held relatively flat while revenues increased on average by 3.3% per year on a $/KWh basis; however energy expenses (BPA) went up by 5.6% per year and non-energy expenses by 6.5% per year. This was an intentional board direction: rates increases were minimized to help with recession recovery and then, in 2012, the Board intentionally began driving down Net Margins and TIER, which was higher due to elevated kWh sales during a cold weather year in 2011.
Trends in Cost of OPALCO Electricity
Impact on Members Bills
Monthly electric bills consists of two parts: a fixed facility charge and a variable energy charge determined by kilowatt hour (KWh) usage. Historically, the energy charge (kWh sales) has represented the majority (60-75%) of the bill so that lower revenues are directly linked to lower sales. While it is good for the member to have a fixed price per unit of electricity, it represents a revenue risk for OPALCO if actual usage falls below predicted. Recently, warmer weather patterns, installation of low-energy lighting and appliances, and more solar generation by members has resulted in a significant downturn in usage per customer compared to forecast and at a time when the customer base is not growing. Had our forecast been on target, the average member bill would have increased by the budgeted 6% instead of the actual increase of only 2.8% in 2014.
The variation in average monthly bill for residential usage is shown here over the last five years. Seasonal demand change is very clear. Year-to-year changes are quite modest.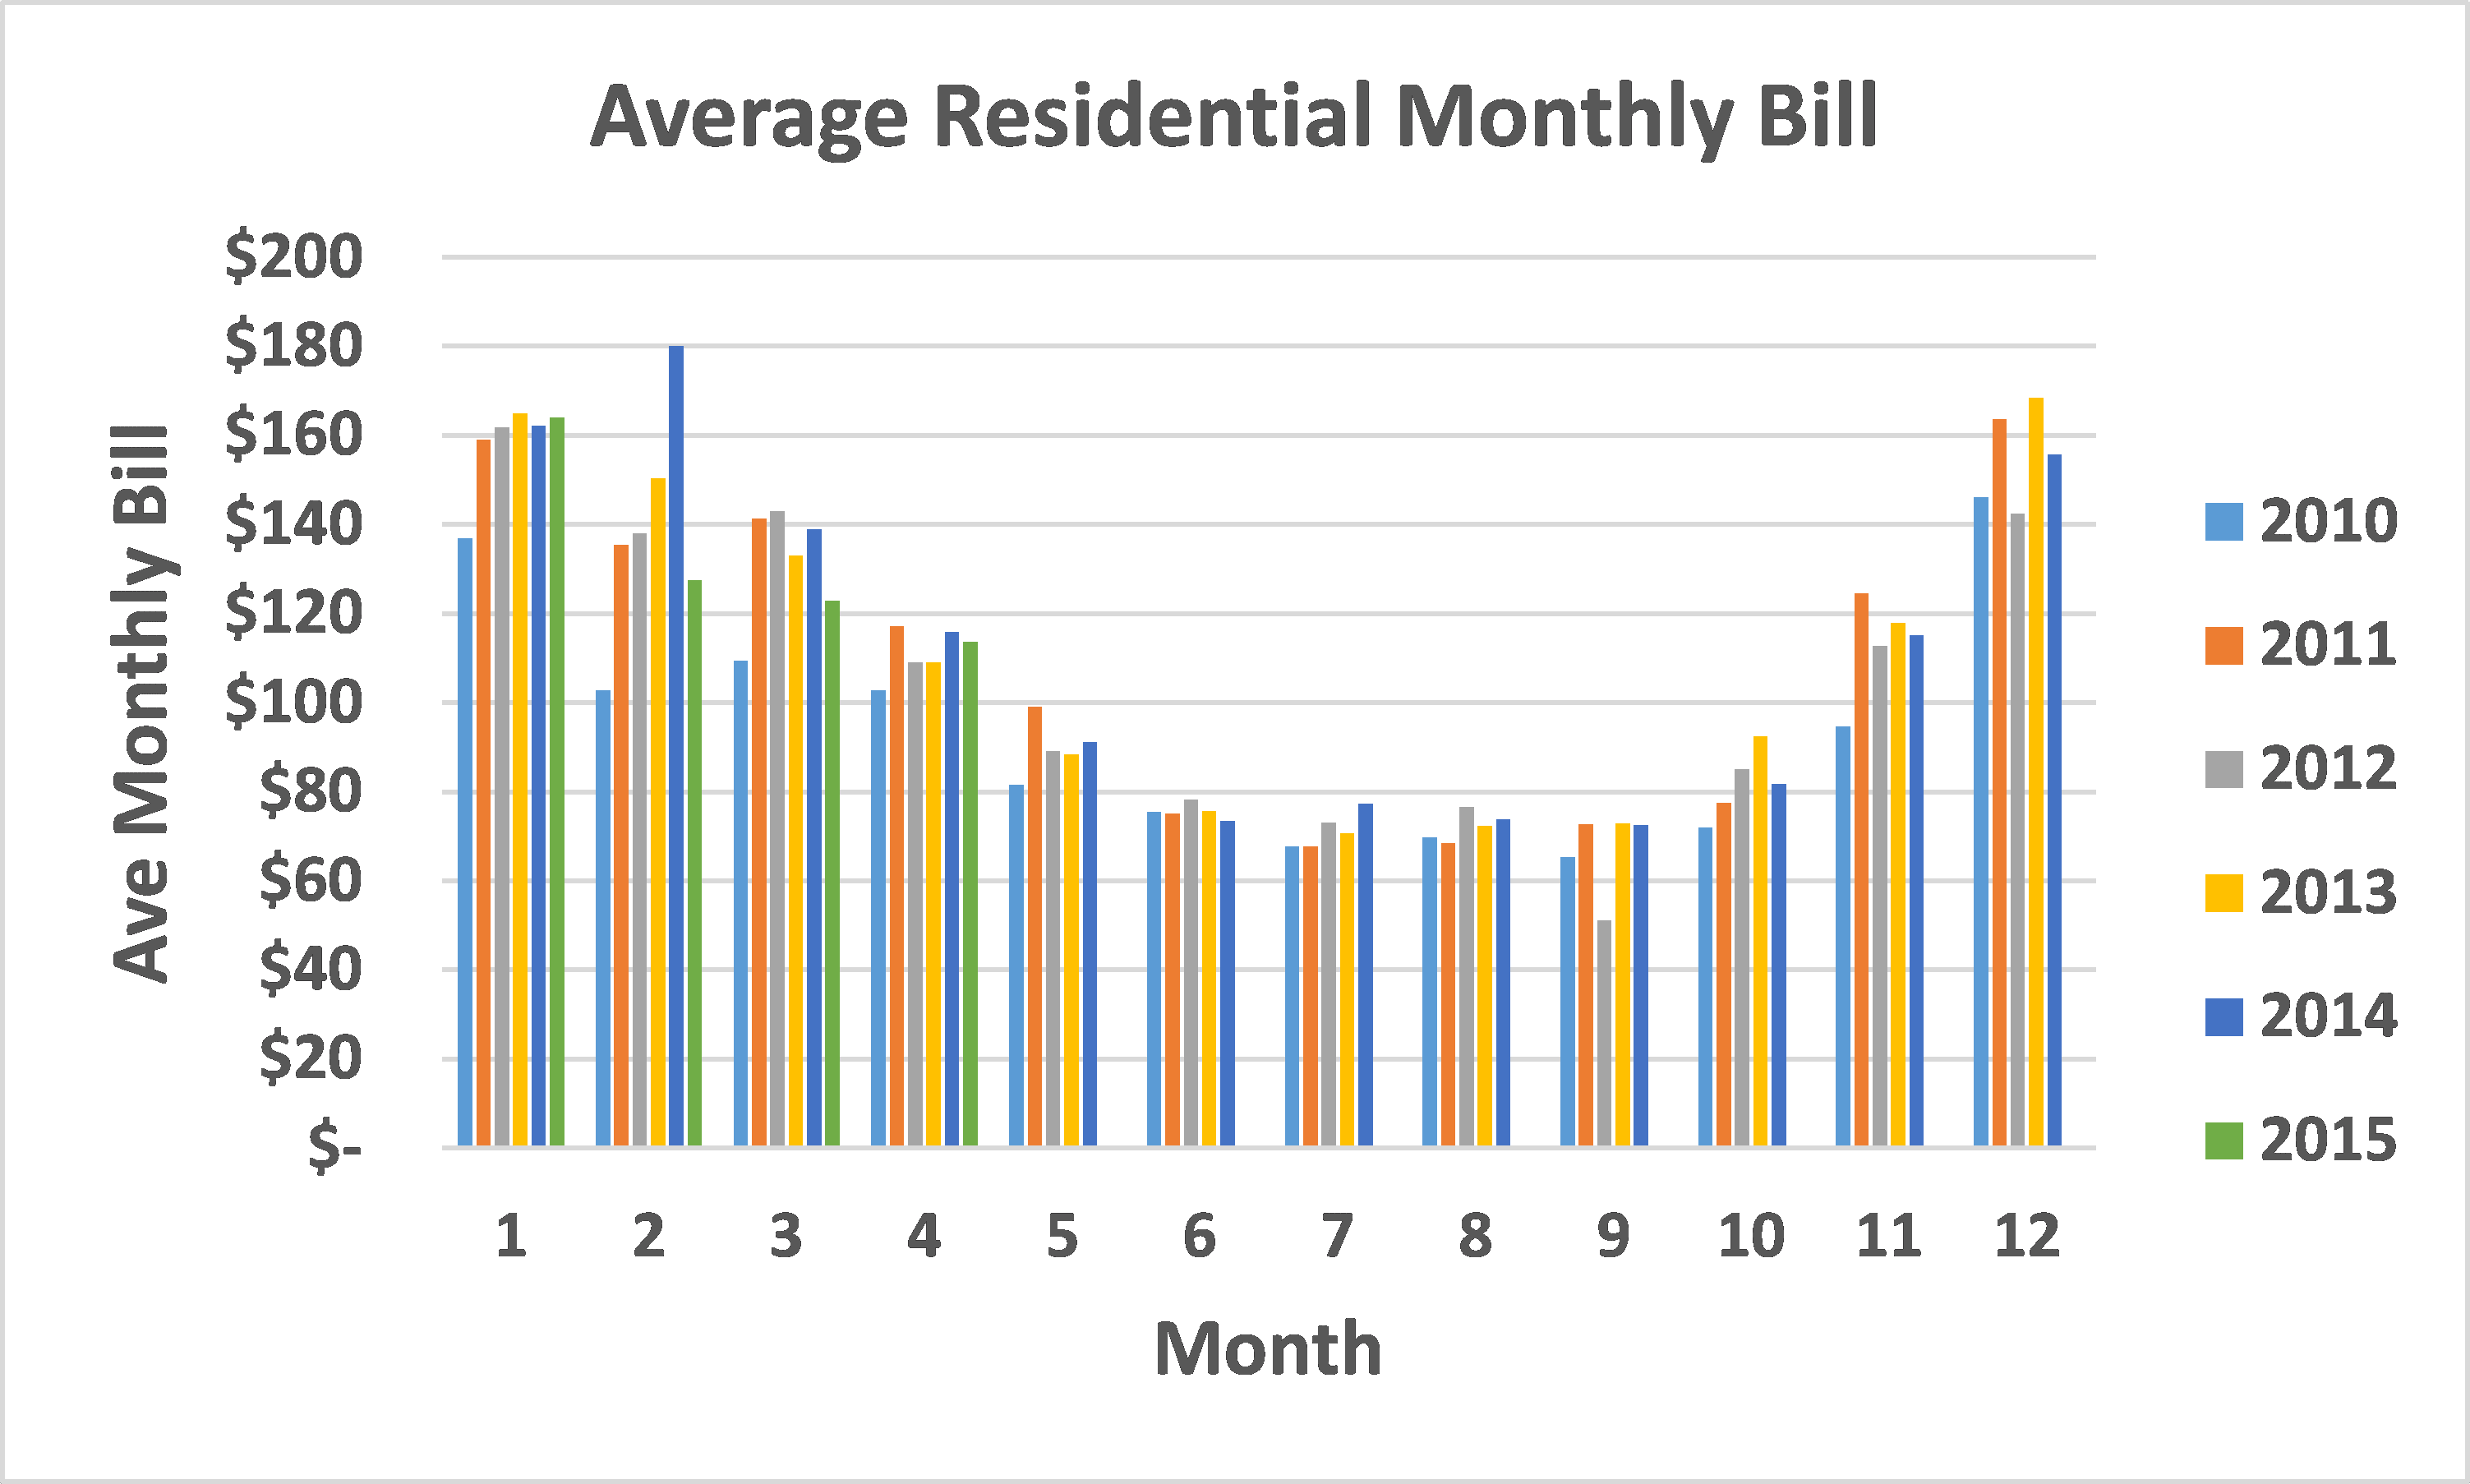
OPALCO Financial Management
Predicting the weather is a difficult task, even with all the BPA expertise and experience OPALCO has in its team and consultants. The warmer weather patterns of late as well as member’s decisions to invest in energy efficiency and local distributed power are beyond OPALCO’s direct control.
Missing the TIER targets has been characterized by some as an expense problem which must be fixed by slashing expenses and capital investment. Expenses were reduced by over $650k (3%) in 2014, but this was insufficient to relieve the underlying problem. This a revenue problem first and foremost that can only be solved by first generating sufficient revenues to cover the true cost of service.
The current challenge for Management and the Board is to rigorously control costs during a time of declining usage, thereby minimizing further rate increases, without compromising safety and reliability of service.
Going forward, OPALCO has a number of capital investment challenges, including replacement of some aging submarine cables and financing the build-out of broadband internet through Rock Island Communications[4].
It is important to note that our investment in broadband was based on a decision made in 2013 and we are fully committed and contractually obligated to see it through to profitability. With the acquisition of Rock Island in February 2015, the risk, timeline and costs involved in meeting this directive have been significantly reduced from our initial proposal and we are on track to reach financial breakeven with a minimal number of connections (2,000-3,000).
The total cost of the capital buildout for our fiber optic backbone is about 2.5% of a member’s electric bill today increasing to a maximum of 5% when completed in 2017 (see chart on the previous page). This is a cost-benefit issue that deserves on-going and systematic review by Management, the Board and the Membership.
This is a challenging period of necessary capital investment. We anticipate higher debt load in the future which will add further to the cost of service and members’ electric bills. This was clearly spelled out in the 2015 Budget. Management and the Board must be aware of the rate impact of these future funding decisions and be prepared to communicate these decisions.
It is important to understand that OPALCO provides an electric service, guaranteeing grid connectivity across many island waterways, and supplying reliable, affordable power to all its members at all times. It is not solely a retail commodity provider of kilowatt hours akin to a gas station or grocery store where the commodity prices depend on supply and demand. As such, member-owners must be prepared to pay the full cost of service regardless of changing weather patterns and decisions made by users to improve their energy efficiency. And the Board must serve the interests of the membership by striving to minimize increases in members’ bills. This is a responsibility that comes with cooperative ownership, and costs must be shared fairly across the membership. Bear in mind that higher rates do not always spell out higher monthly bills (see above chart, Average Residential Monthly Bill).
Where do we go from here? There are a number of ideas on the table for rate structure solutions and discussion will continue at future Board Meetings. No matter how we go forward, there will be trade-offs including unintended consequences and tough decisions to make, such as:
- When we structure rates to encourage conservation (higher kWh charges, lower facilities charge), members have more control of their bills but our revenue is more subject to volatility based on weather and usage and, an unintended consequence is that, part-time members are subsidized by full-time members for the year-round fixed costs of the infrastructure that serves them.
- If we try to encourage fuel switching (replacing member propane and gas usage with hydropower), the rate structure includes lower KWh charges and a higher facilities charge which reduces revenue volatility, encourages new electric load and revenue and charges part-time members their full cost of service year round. The trade-offs are less reward for conservation and less member control over their bills.
- As rates go up, what role should the Co-op play in addressing affordability in San Juan County? Does the membership want to subsidize a rate relief program for qualified seniors and low-income member household through increased rates? Our county-wide low-income assessment in process this summer will provide key information on this important affordability issue.
Members are invited to weigh in on these important questions by taking a survey online at www.opalco.com/survey. The results of this survey will help inform our decision making during the 2016 budget process.
To follow the conversation, members can read each Board packet when they are posted online (find documents/board materials). To participate in the discussions, board meetings are open to members and provide a forum for exchanges of information and ideas. If you have questions, come to the source: the wealth of information online and our knowledgeable staff and leadership. Social media helps to broaden participation in the conversation, but should not be mistaken for the conversation itself.
Notes and links:
[1] Cost of service = (total operating expenses + total fixed charges (interest in long term debt) + net margin)
[2] Times Interest Earned Ratio = (Net Margin + Interest)/(Interest) = 1 + (Net Margin/Interest)
[3] Orcas Power and Light Cooperative Electric Cost of Service and Rate Study, Final. EES Consulting. Feb 12th 2015. https://www.opalco.com/wp-content/uploads/2015/04/Rate-Design-COSA.pdf
pp25-77.
[4]2015 Capital Projects Budget. https://www.opalco.com/wp-content/uploads/2015/01/2015-Capital-Projects-Budget.pdf

